

S&P 500
A small upwards day fits expectations for the short term. At the end of the week, volume and breadth are pointing to the direction for next week.
Summary: The upwards trend is expected to fairly likely resume with strength next week. The pullback may be over at the low of the 26th of June. Strong volume on Friday with new all time highs for the AD line support this view.
The next short-term target is at 3,058. This next upwards wave may exhibit further strength. Look for corrections to continue to be very shallow and brief.
The mid-term target remains at 3,104 for a more time consuming consolidation or pullback, which may also be shallow.
The biggest picture, Grand Super Cycle analysis, is here.
Monthly charts were last published here, with video here. There are two further alternate monthly charts here. Video is here.
ELLIOTT WAVE COUNTS
The two Elliott wave counts below will be labelled First and Second. They may be about of even probability. When the fifth wave currently unfolding on weekly charts may be complete, then these two wave counts will diverge on the severity of the expected following bear market. To see an illustration of this future divergence monthly charts should be viewed.
FIRST WAVE COUNT
WEEKLY CHART
Click chart to enlarge.
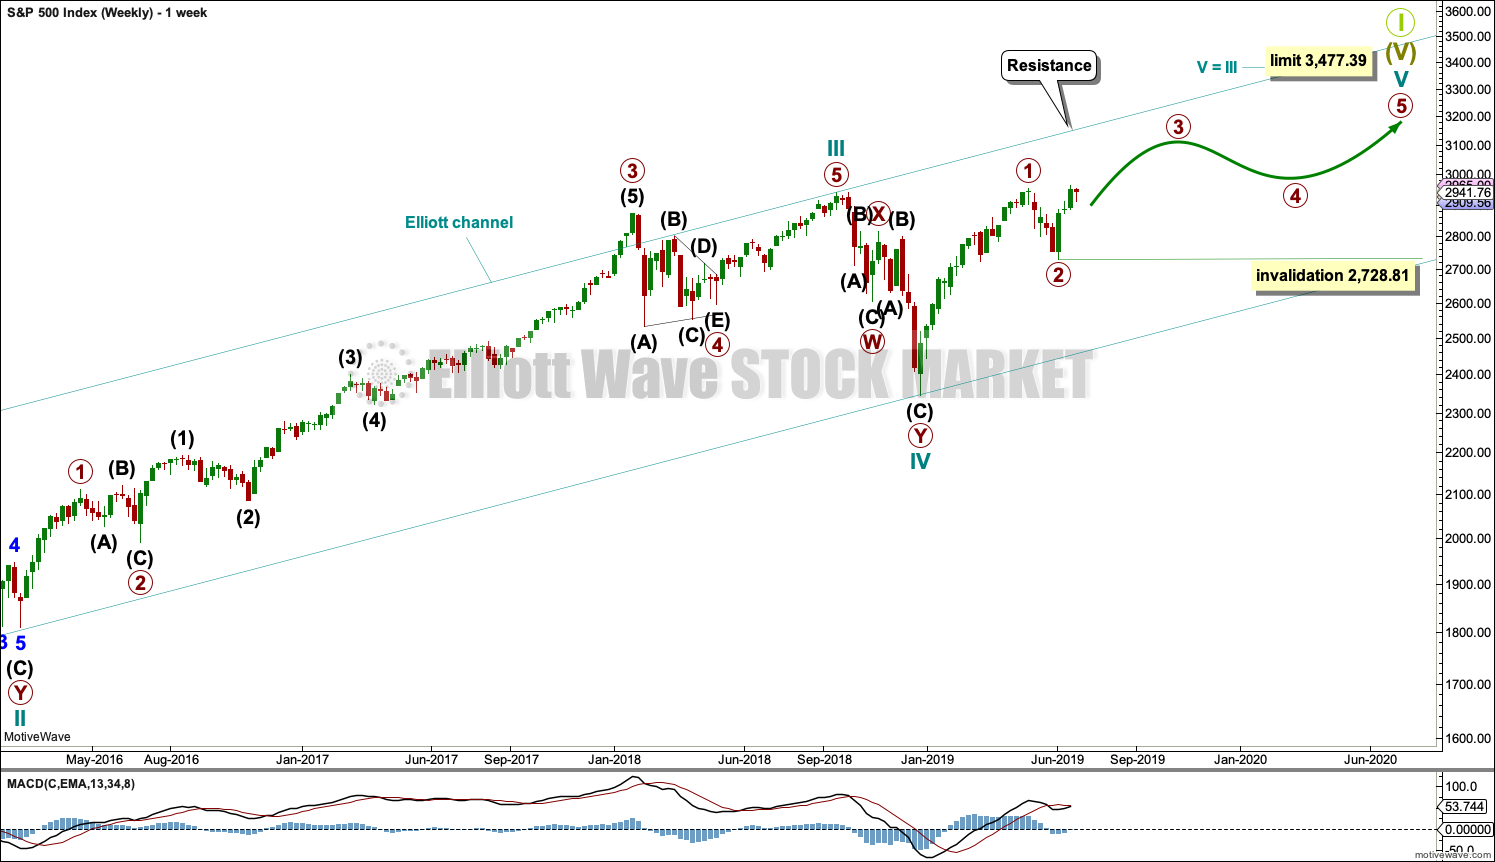
The basic Elliott wave structure consists of a five wave structure up followed by a three wave structure down (for a bull market). This wave count sees the bull market beginning in March 2009 as an incomplete five wave impulse and now within the last fifth wave, which is labelled cycle wave V. This impulse is best viewed on monthly charts. The weekly chart focusses on the end of it.
Elliott wave is fractal. This fifth wave labelled cycle wave V may end a larger fifth wave labelled Super Cycle wave (V), which may end a larger first wave labelled Grand Super Cycle wave I.
The teal Elliott channel is drawn using Elliott’s first technique about the impulse of Super Cycle wave (V). Draw the first trend line from the end of cycle wave I (off to the left of the chart, the weekly candlestick beginning 30th November 2014) to the end of cycle wave III, then place a parallel copy on the end of cycle wave II. This channel perfectly shows where cycle wave IV ended at support. The strongest portion of cycle wave III, the end of primary wave 3, overshoots the upper edge of the channel. This is a typical look for a third wave and suggests the channel is drawn correctly and the way the impulse is counted is correct.
Within Super Cycle wave (V), cycle wave III is shorter than cycle wave I. A core Elliott wave rule states that a third wave may never be the shortest. For this rule to be met in this instance, cycle wave V may not be longer in length than cycle wave III. This limit is at 3,477.39.
The structure of cycle wave V is focussed on at the daily chart level below.
Within cycle wave V, primary waves 1 and 2 may now be complete. Within primary wave 3, no second wave correction may move beyond its start below 2,728.81.
In historic analysis, two further monthly charts have been published that do not have a limit to upwards movement and are more bullish than this wave count. Members are encouraged to consider those possibilities (links below summary) alongside the wave counts presented on a daily and weekly basis.
DAILY CHART
Click chart to enlarge.
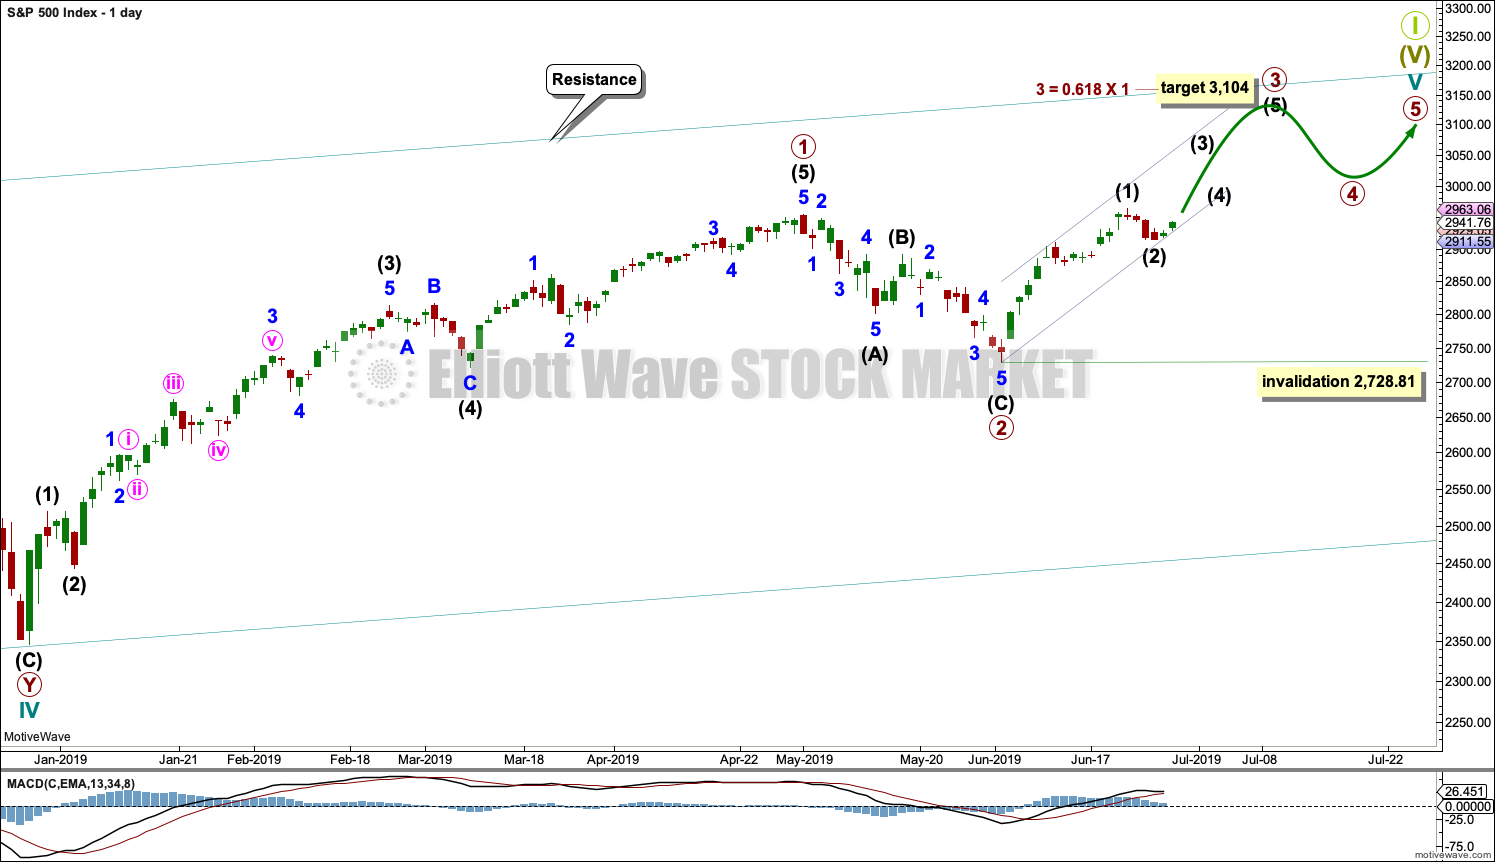
Cycle wave V must subdivide as a five wave motive structure. Within that five wave structure, primary waves 1 and 2 may be complete.
Primary wave 3 must move above the end of primary wave 1 (this rule has now been met). Primary wave 3 may only subdivide as an impulse. Within the impulse, intermediate wave (1) may have been over at the last high. Intermediate wave (2) may now also be complete, but if it continues lower it may not move beyond the start of intermediate wave (1) below 2,728.81.
When primary wave 3 is over, then primary wave 4 may be a shallow sideways consolidation.
Thereafter, primary wave 5 should move above the end of primary wave 3 to avoid a truncation.
Primary wave 1 lasted 86 sessions, 3 short of a Fibonacci 89. Primary wave 2 lasted 22 sessions, 1 longer than a Fibonacci 21. Primary wave 3 may end about a Fibonacci 55 sessions, give or take two or three sessions either side. This is a rough guideline only.
So far primary wave 3 has lasted 19 sessions.
SECOND WAVE COUNT
WEEKLY CHART
Click chart to enlarge.
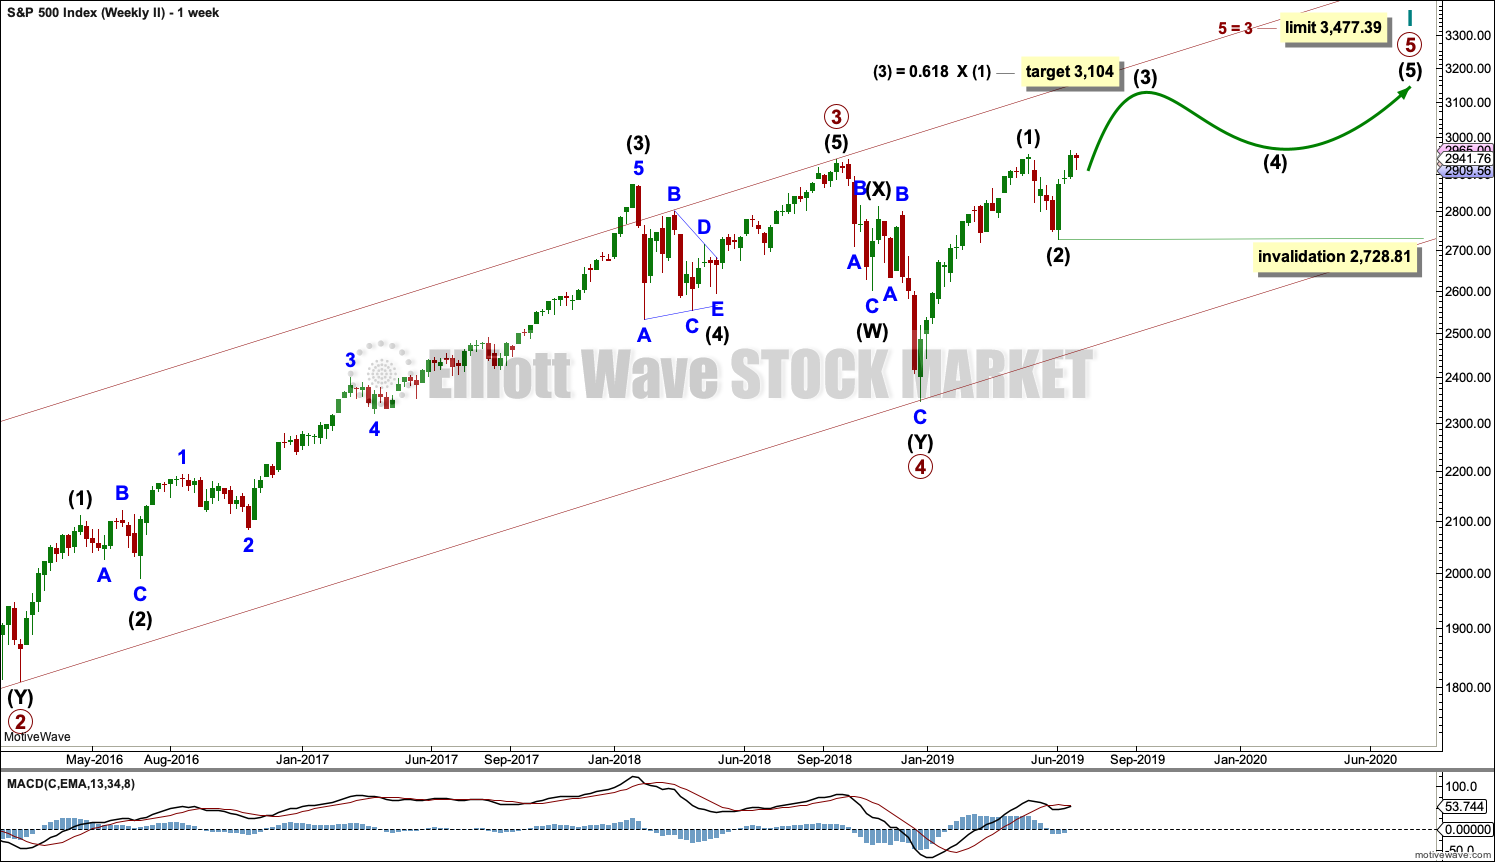
This weekly chart is almost identical to the first weekly chart, with the sole exception being the degree of labelling.
This weekly chart moves the degree of labelling for the impulse beginning in March 2009 all down one degree. This difference is best viewed on monthly charts.
The impulse is still viewed as nearing an end; a fifth wave is still seen as needing to complete higher. This wave count labels it primary wave 5.
TECHNICAL ANALYSIS
WEEKLY CHART
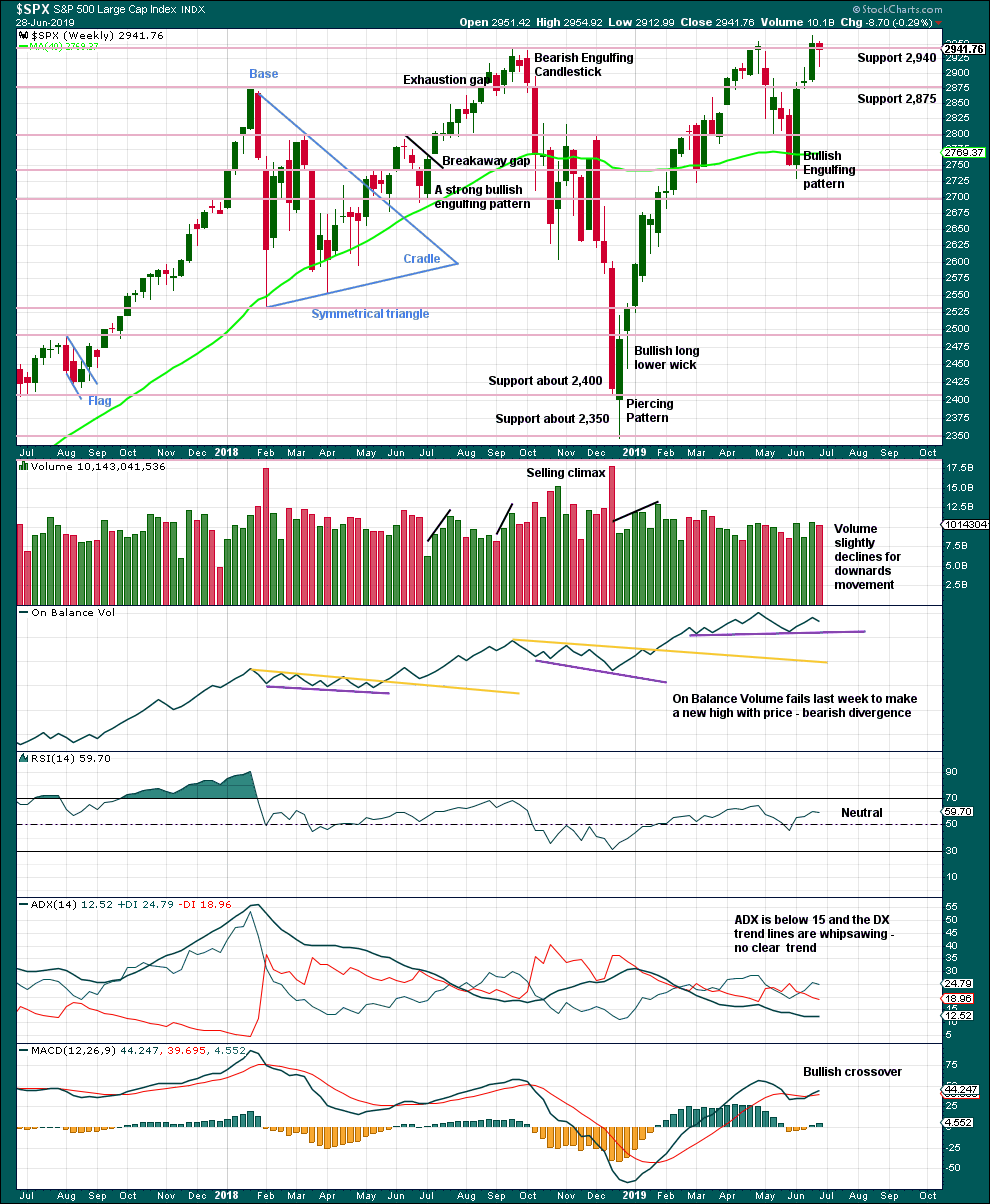
Click chart to enlarge. Chart courtesy of StockCharts.com.
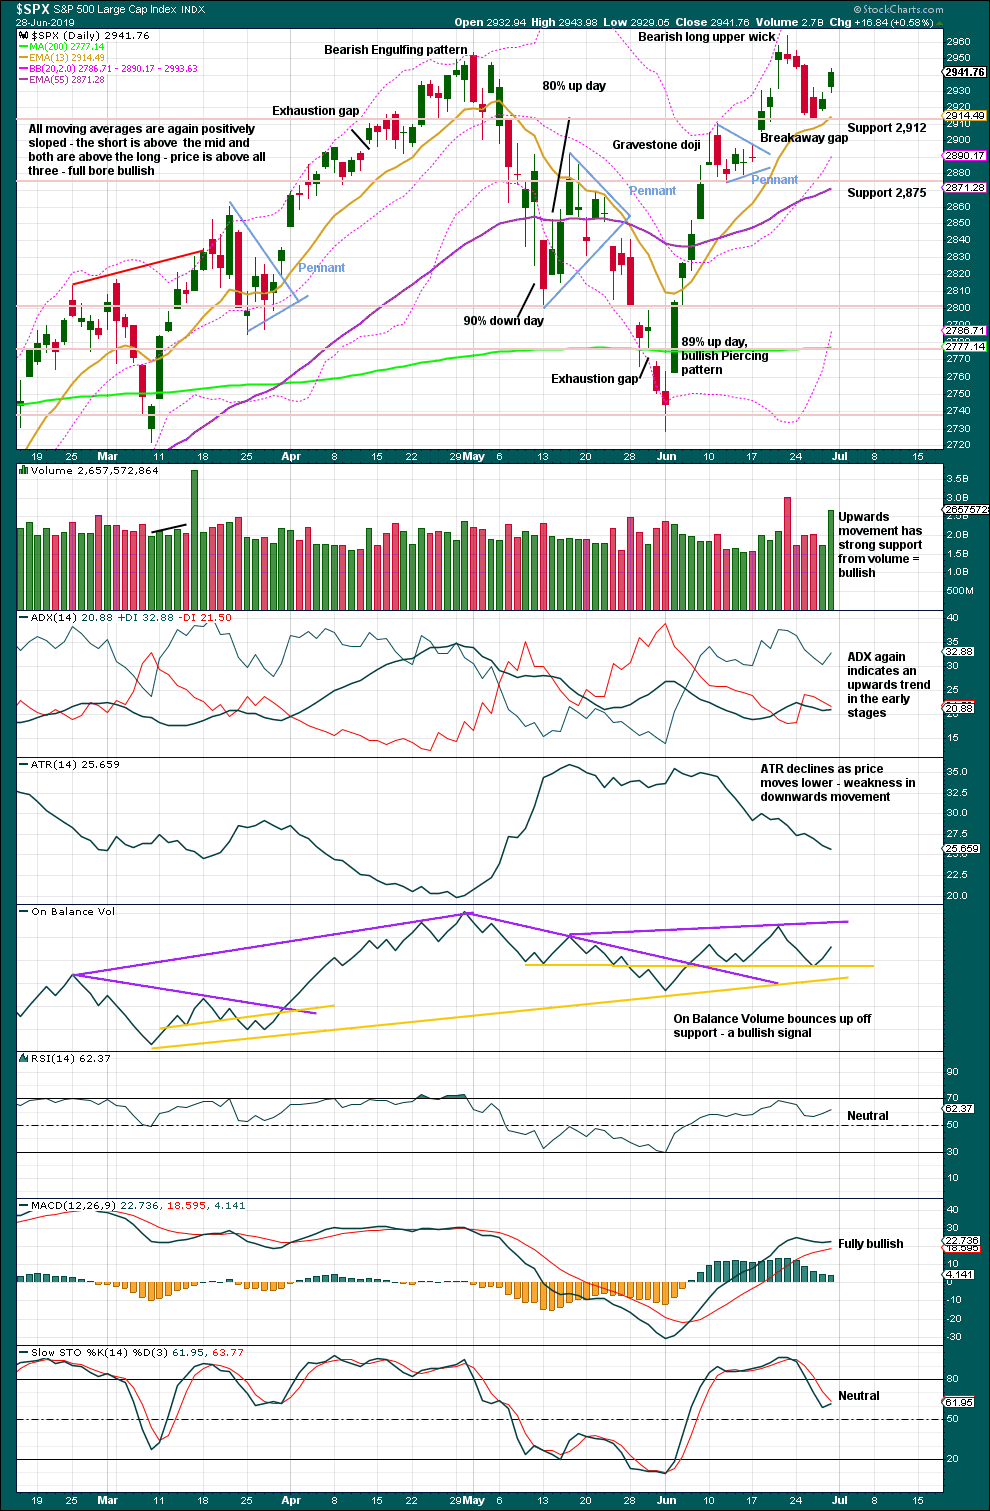
A long lower wick suggests more upwards movement next week.
DAILY CHART
Click chart to enlarge. Chart courtesy of StockCharts.com.
Support may have held about 2,912. The bounce has strength; the pullback may be over.
RSI and Stochastics are not extreme. ADX indicates an upwards trend in its early stages. This chart is very bullish.
BREADTH – AD LINE
WEEKLY CHART
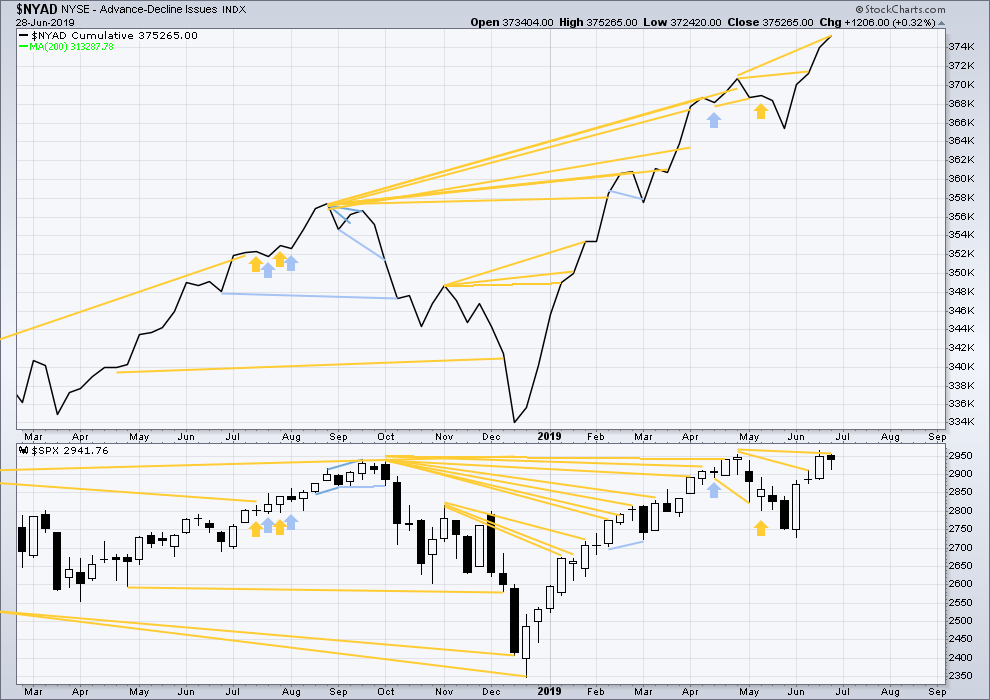
Click chart to enlarge. Chart courtesy of StockCharts.com. So that colour blind members are included, bearish signals
will be noted with blue and bullish signals with yellow.
Bear markets from the Great Depression and onwards have been preceded by an average minimum of 4 months divergence between price and the AD line with only two exceptions in 1946 and 1976. With the AD line making new all time highs again this week, the end of this bull market and the start of a new bear market is very likely a minimum of 4 months away, which is mid October 2019.
In all bear markets in the last 90 years there is some positive correlation (0.6022) between the length of bearish divergence and the depth of the following bear market. No to little divergence is correlated with more shallow bear markets. Longer divergence is correlated with deeper bear markets.
If a bear market does develop here, it comes after no bearish divergence. It would therefore more likely be shallow.
Two weeks ago large caps made new all time highs, but mid caps are a little distance off doing so and small caps are lagging far behind. This is normal in the latter stages of an aged bull market.
For the shorter term, there is strength within mid and large caps. This week both have made new short-term swing highs above prior highs of the 20th of June.
DAILY CHART
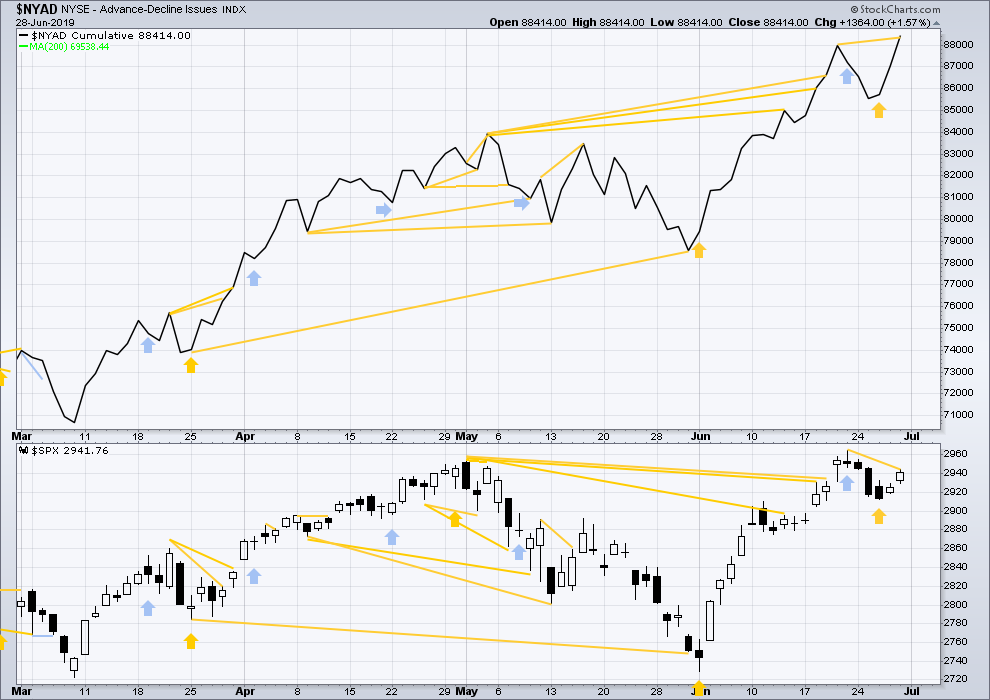
Click chart to enlarge. Chart courtesy of StockCharts.com. So that colour blind members are included, bearish signals
will be noted with blue and bullish signals with yellow.
Breadth should be read as a leading indicator.
The AD line has made a new all time high on Friday, but price has not. This divergence is bullish.
VOLATILITY – INVERTED VIX CHART
WEEKLY CHART
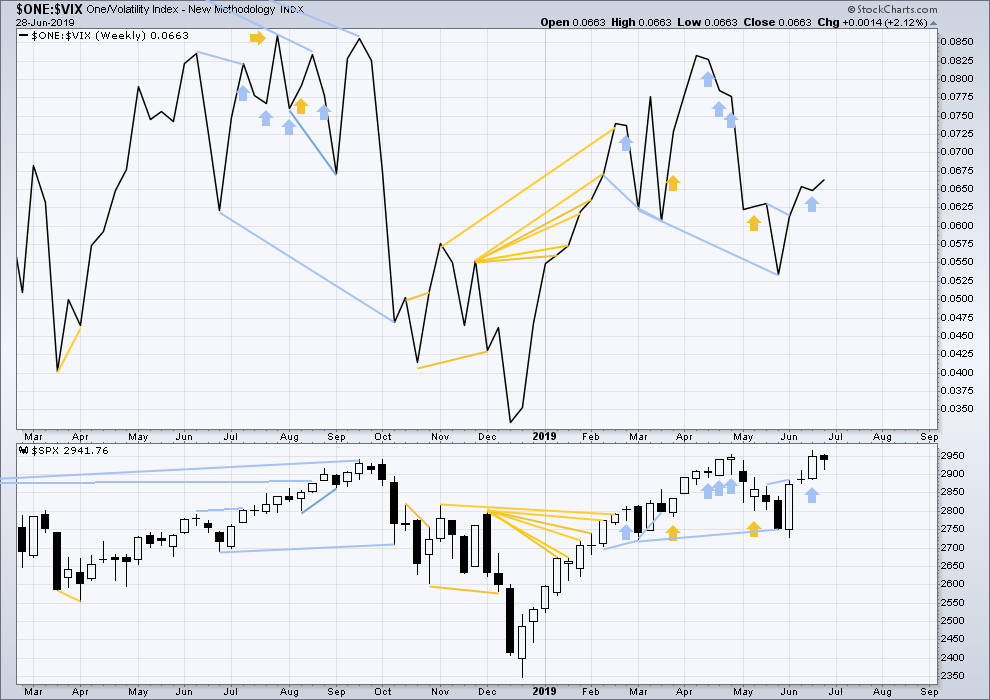
Click chart to enlarge. Chart courtesy of StockCharts.com. So that colour blind members are included, bearish signals
will be noted with blue and bullish signals with yellow.
Long-term bearish divergence remains. It may develop further before the upwards trend ends.
This week price moved sideways and inverted VIX has moved slightly higher. Upwards movement within the week has support from declining VIX, which may be interpreted as bullish.
DAILY CHART
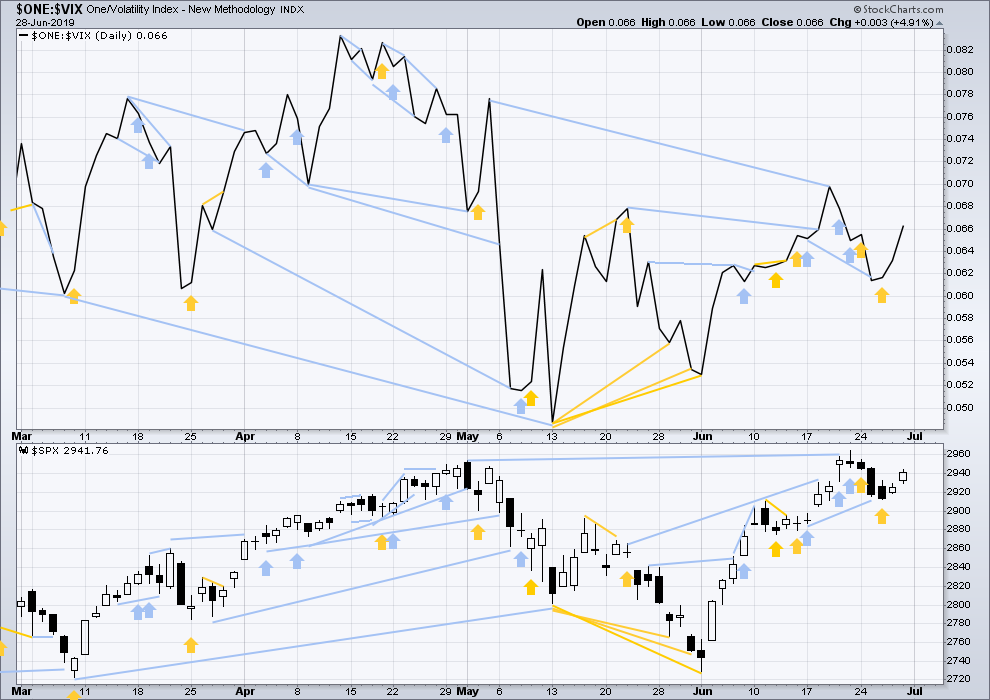
Click chart to enlarge. Chart courtesy of StockCharts.com. So that colour blind members are included, bearish signals
will be noted with blue and bullish signals with yellow.
Today both price and inverted VIX have moved higher. Neither have made new highs. There is no new divergence.
DOW THEORY
Dow Theory confirmed a bear market in December 2018. This does not necessarily mean a bear market at Grand Super Cycle degree though; Dow Theory makes no comment on Elliott wave counts. On the 25th of August 2015 Dow Theory also confirmed a bear market. The Elliott wave count sees that as part of cycle wave II. After Dow Theory confirmation of a bear market in August 2015, price went on to make new all time highs and the bull market continued.
DJIA: 23,344.52 – a close on the 19th of December at 23,284.97 confirms a bear market.
DJT: 9,806.79 – price has closed below this point on the 13th of December.
S&P500: 2,532.69 – a close on the 19th of December at 2,506.96 provides support to a bear market conclusion.
Nasdaq: 6,630.67 – a close on the 19th of December at 6,618.86 provides support to a bear market conclusion.
With all the indices having moved higher following a Dow Theory bear market confirmation, Dow Theory would confirm a bull market if the following highs are made:
DJIA: 26,951.81
DJT: 11,623.58
S&P500: 2,940.91 – a new all time high has been made on the 29th of April 2019.
Nasdaq: 8,133.30 – a new high has been made on 24th of April 2019.
GOLD
At the end of this week, volume suggests the direction for next week.
Summary: A high may now be in place earlier than expected for the bearish Elliott wave count. Price may continue higher towards 1,565 for the bullish Elliott wave count.
Next week price may come down to effect a back test of support about 1,375. How price behaves if it gets to this point may illustrate which Elliott wave count may be most likely.
A new low by any amount at any time frame now below 1,346.45 would invalidate the bullish wave count and give confidence to the bearish wave count.
The bullish wave count has a long-term target at 1,693 for cycle wave III to end.
Grand SuperCycle analysis is here.
Last monthly charts are here. Video is here.
Overall, the bearish wave counts still have a higher probability based upon Elliott wave structures. However, it would be best to leave price to invalidate either the bullish or bearish scenario before having confidence in which is correct.
BEARISH ELLIOTT WAVE COUNTS
FIRST WEEKLY CHART
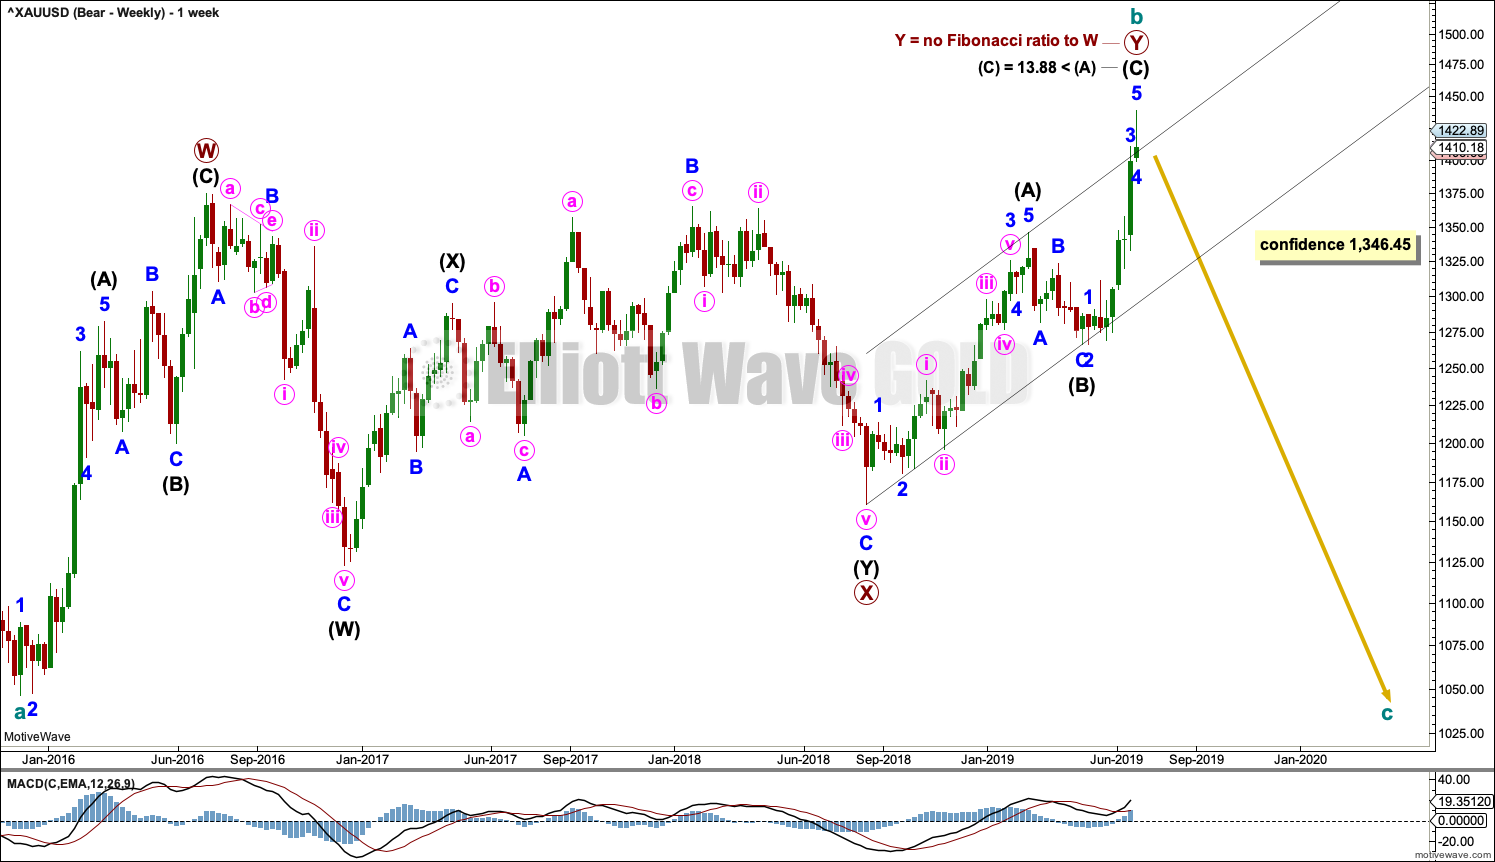
Click chart to enlarge.
It remains possible that the bear market for Gold may yet continue when cycle wave b is complete, and it is possible that cycle wave b may be complete at the high. Cycle wave b may be a double zigzag.
Double zigzags are common structures, but within them their X waves are almost always single zigzags that are relatively brief and shallow. However, X waves may be any corrective structure, including a multiple.
The maximum number of corrective structures in a multiple is three. This count of three refers to W, Y and Z. To label any one of W, Y or Z as multiples violates this Elliott wave rule. However, X waves may be labelled as multiples and here the rule is met. X waves do occasionally subdivide as multiples.
This wave count sees primary wave X as a complete double combination: zigzag – X – expanded flat.
Primary wave Y may be a complete zigzag. The purpose of a second zigzag in a double zigzag is to deepen the correction when the first zigzag does not move price far enough. This purpose has been achieved.
A new low now by any amount at any time frame below 1,346.45 would invalidate the bullish wave count below and provide some confidence in this wave count.
DAILY CHART
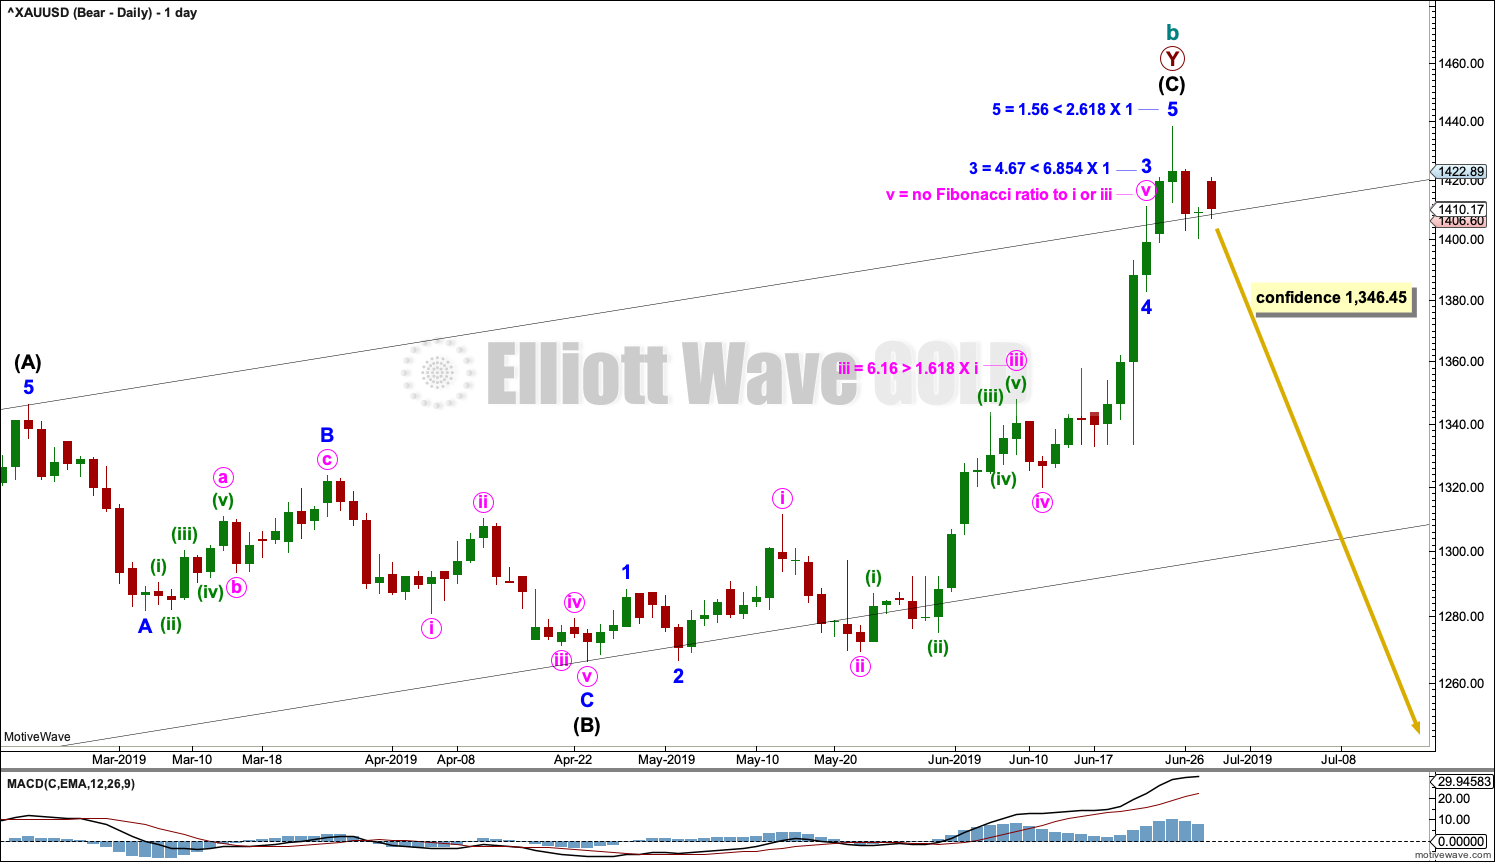
Click chart to enlarge.
This chart focusses on the impulse of intermediate wave (C).
Intermediate wave (C) may be a complete impulse; the structure may now be complete at all time frames. There is a bearish candlestick reversal pattern on StockCharts data.
This wave count now requires a new low below 1,346.45 for confidence.
SECOND DAILY CHART
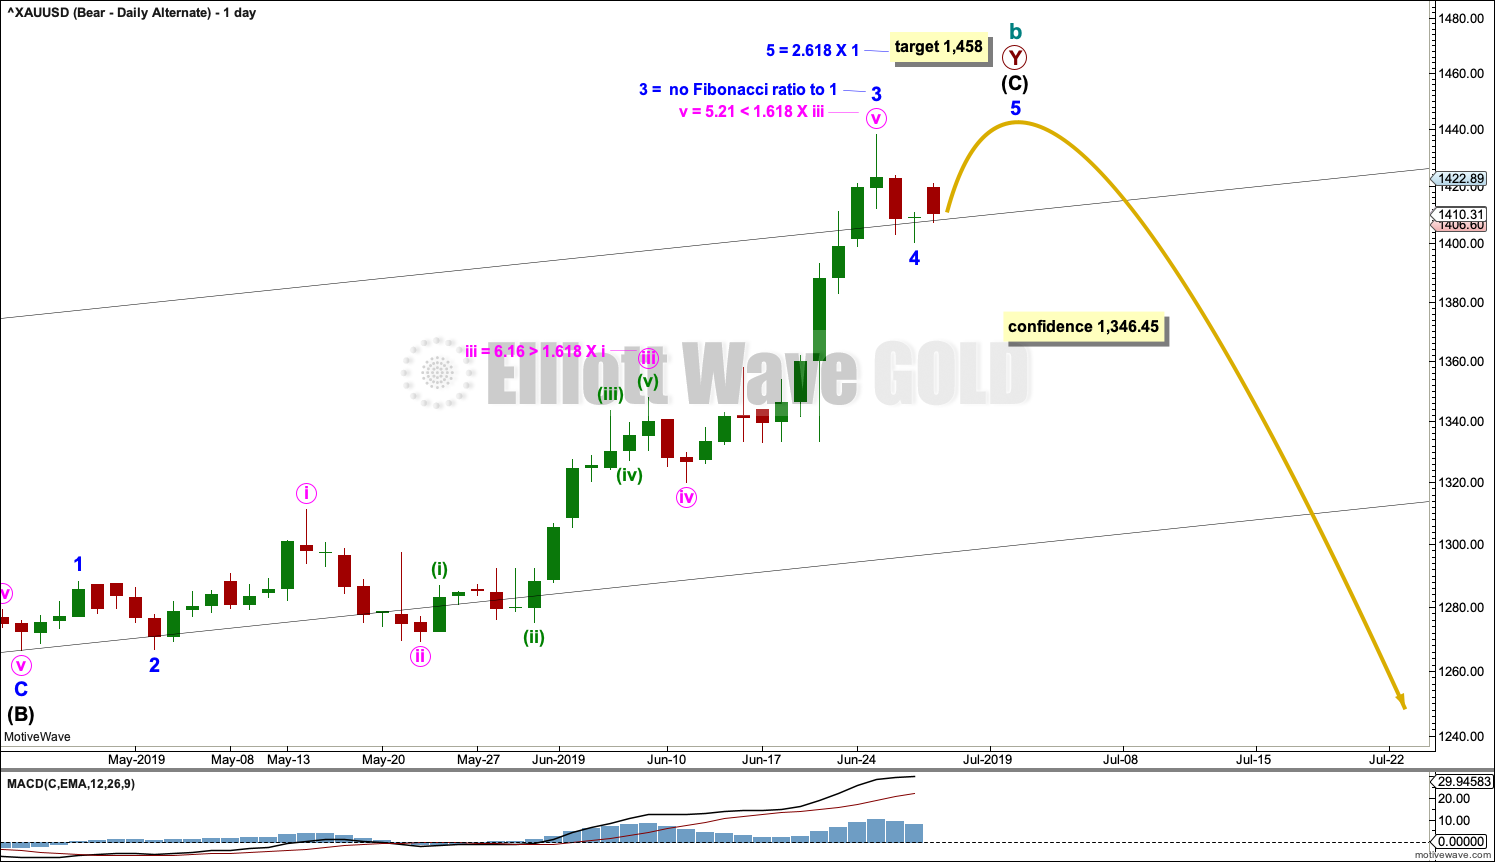
Click chart to enlarge.
It is also possible that intermediate wave (C) may be an incomplete impulse and the last three sessions may be another correction within an ongoing upwards trend.
A target is calculated for minor wave 5 to end. About this target intermediate wave (C) would also be closer to equality in length with intermediate wave (A).
SECOND WEEKLY CHART
The second weekly chart published in last analysis also remains viable but will not be continued here in an effort to keep the number of charts manageable. It will be published again if it begins to diverge from the first bearish weekly chart.
BULLISH ELLIOTT WAVE COUNT
WEEKLY CHART
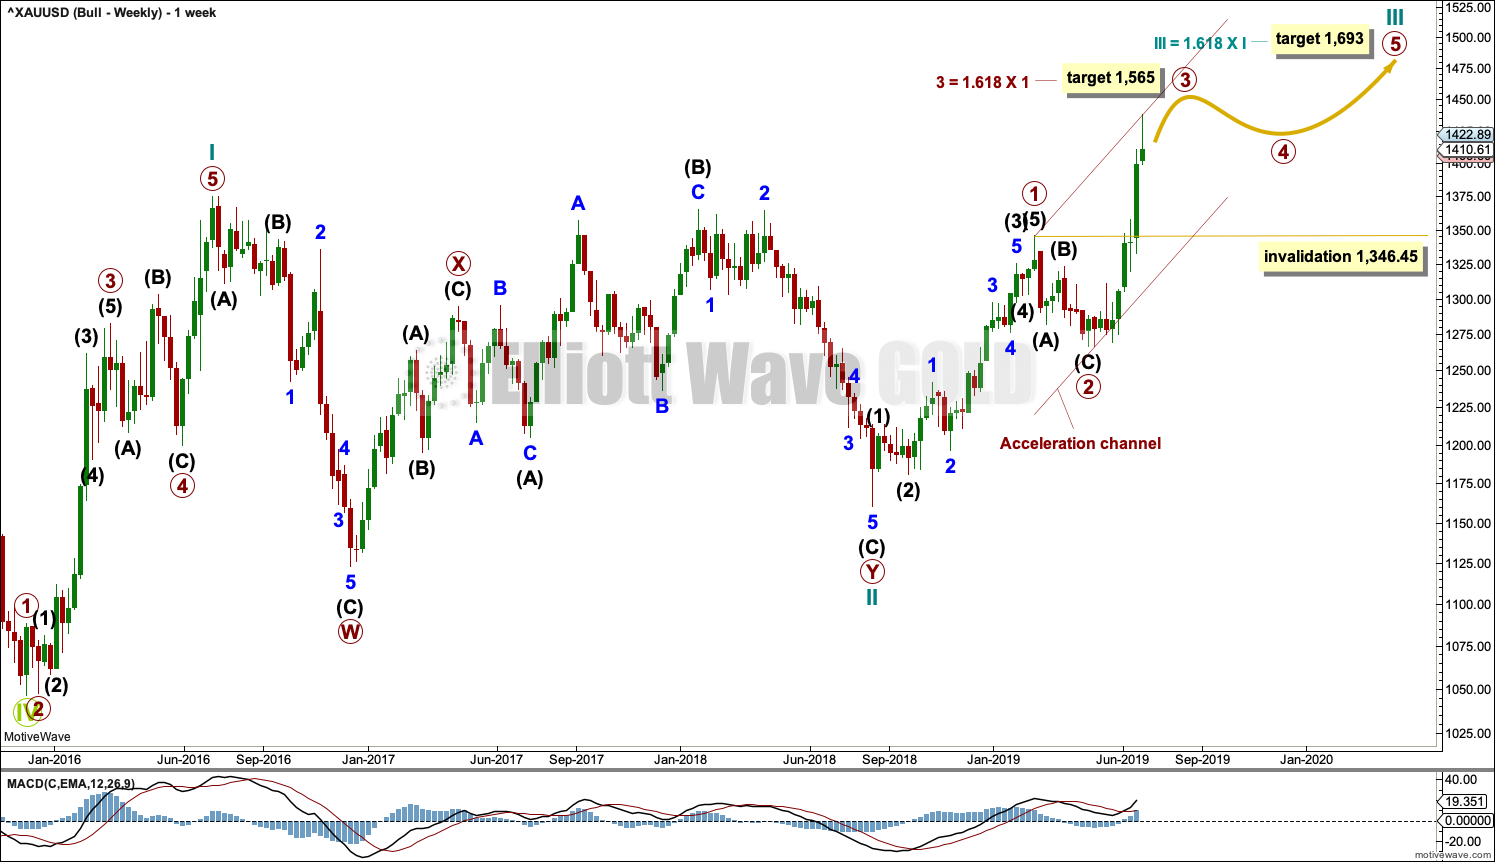
Click chart to enlarge.
This wave count sees the the bear market complete at the last major low for Gold in November 2015.
If Gold is in a new bull market, then it should begin with a five wave structure upwards on the weekly chart. However, the biggest problem with this wave count is the structure labelled cycle wave I because this wave count must see it as a five wave structure, but it looks more like a three wave structure.
Commodities often exhibit swift strong fifth waves that force the fourth wave corrections coming just prior and just after to be more brief and shallow than their counterpart second waves. It is unusual for a commodity to exhibit a quick second wave and a more time consuming fourth wave, and this is how cycle wave I is labelled. This wave count still suffers from this very substantial problem, and for this reason two bearish wave counts are still considered above as they have a better fit in terms of Elliott wave structure.
Cycle wave II subdivides well as a double combination: zigzag – X – expanded flat.
Cycle wave III may have begun. Within cycle wave III, primary waves 1 and 2 may now be complete. If it continues lower as a double zigzag, then primary wave 2 may not move beyond the start of primary wave 1 below 1,160.75.
Cycle wave III so far for this wave count would have been underway now for 45 weeks. It may be beginning to exhibit some support from volume and increasing ATR. If this increase continues, then this wave count would have some support from technical analysis.
Draw an acceleration channel about primary waves 1 and 2: draw the first trend line from the end of primary wave 1 to the last high, then place a parallel copy on the end of primary wave 2. Keep redrawing the channel as price continues higher. When primary wave 3 is complete, then this channel would be drawn using Elliott’s first technique about the impulse. The lower edge may provide support.
Primary wave 4 may not move into primary wave 1 price territory below 1,346.45.
DAILY CHART
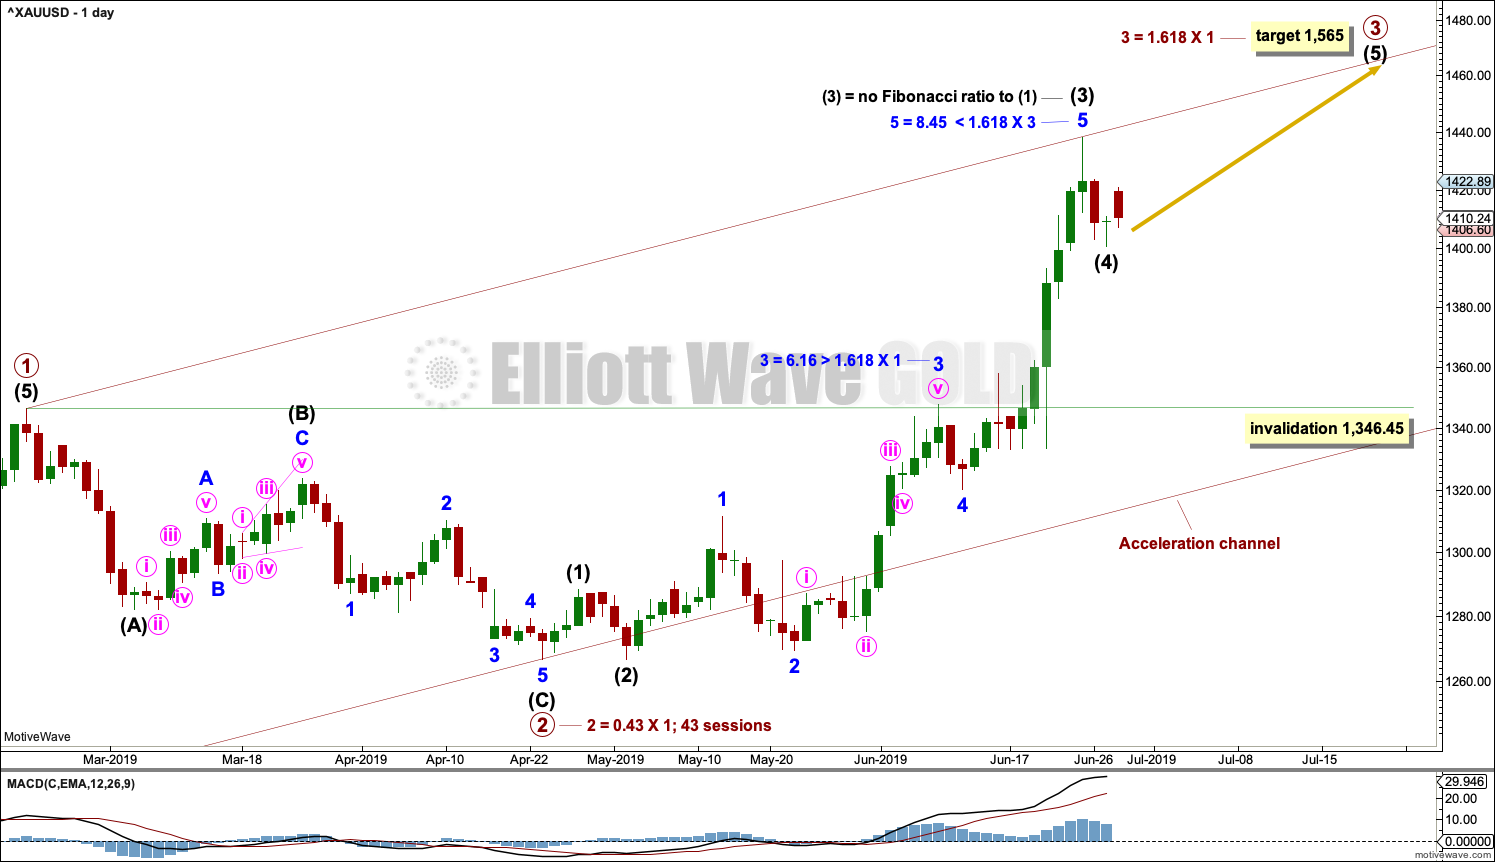
Click chart to enlarge.
This daily chart focusses on the impulse of primary wave 3.
Primary wave 3 may only subdivide as an impulse. Primary wave 3 has now moved above the end of primary wave 1, meeting a core Elliott wave rule.
When it arrives, primary wave 4 may not move into primary wave 1 price territory below 1,346.45.
Intermediate wave (5) may exhibit further strength. The target for primary wave 3 is calculated using the most common Fibonacci ratio to primary wave 1.
The structure of primary wave 3 as an incomplete impulse for this wave count is seen in exactly the same way as the incomplete impulse for intermediate wave (C) in the second bearish daily chart.
TECHNICAL ANALYSIS
MONTHLY CHART
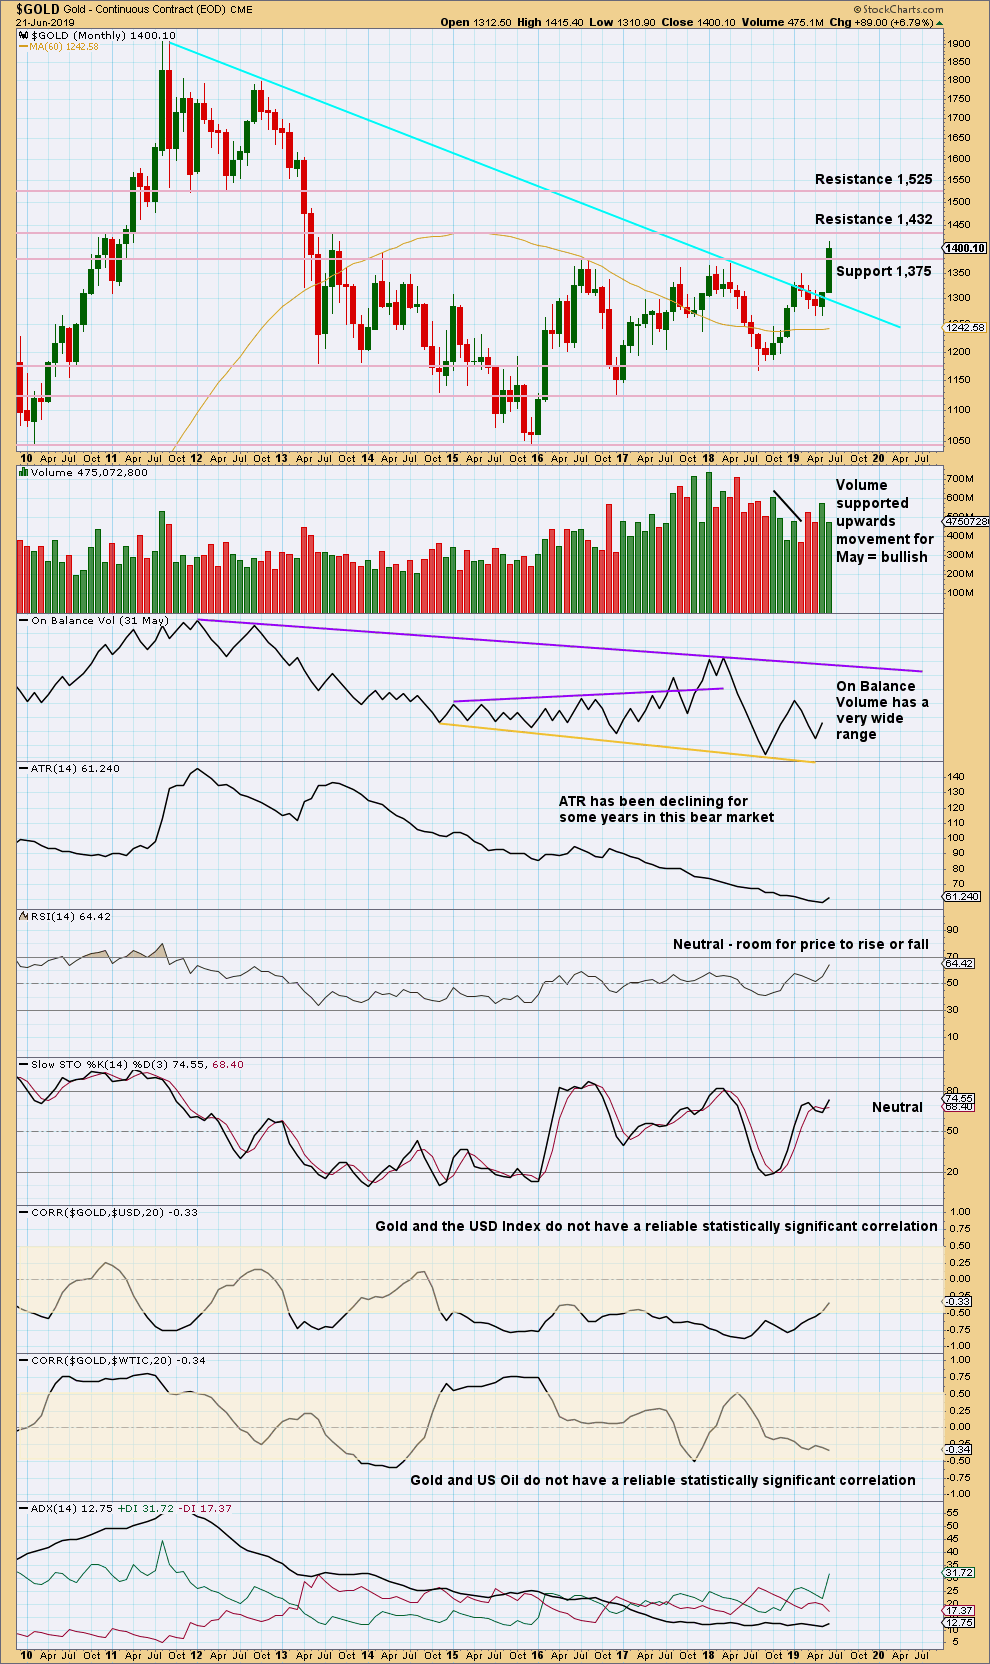
Click chart to enlarge. Chart courtesy of StockCharts.com.
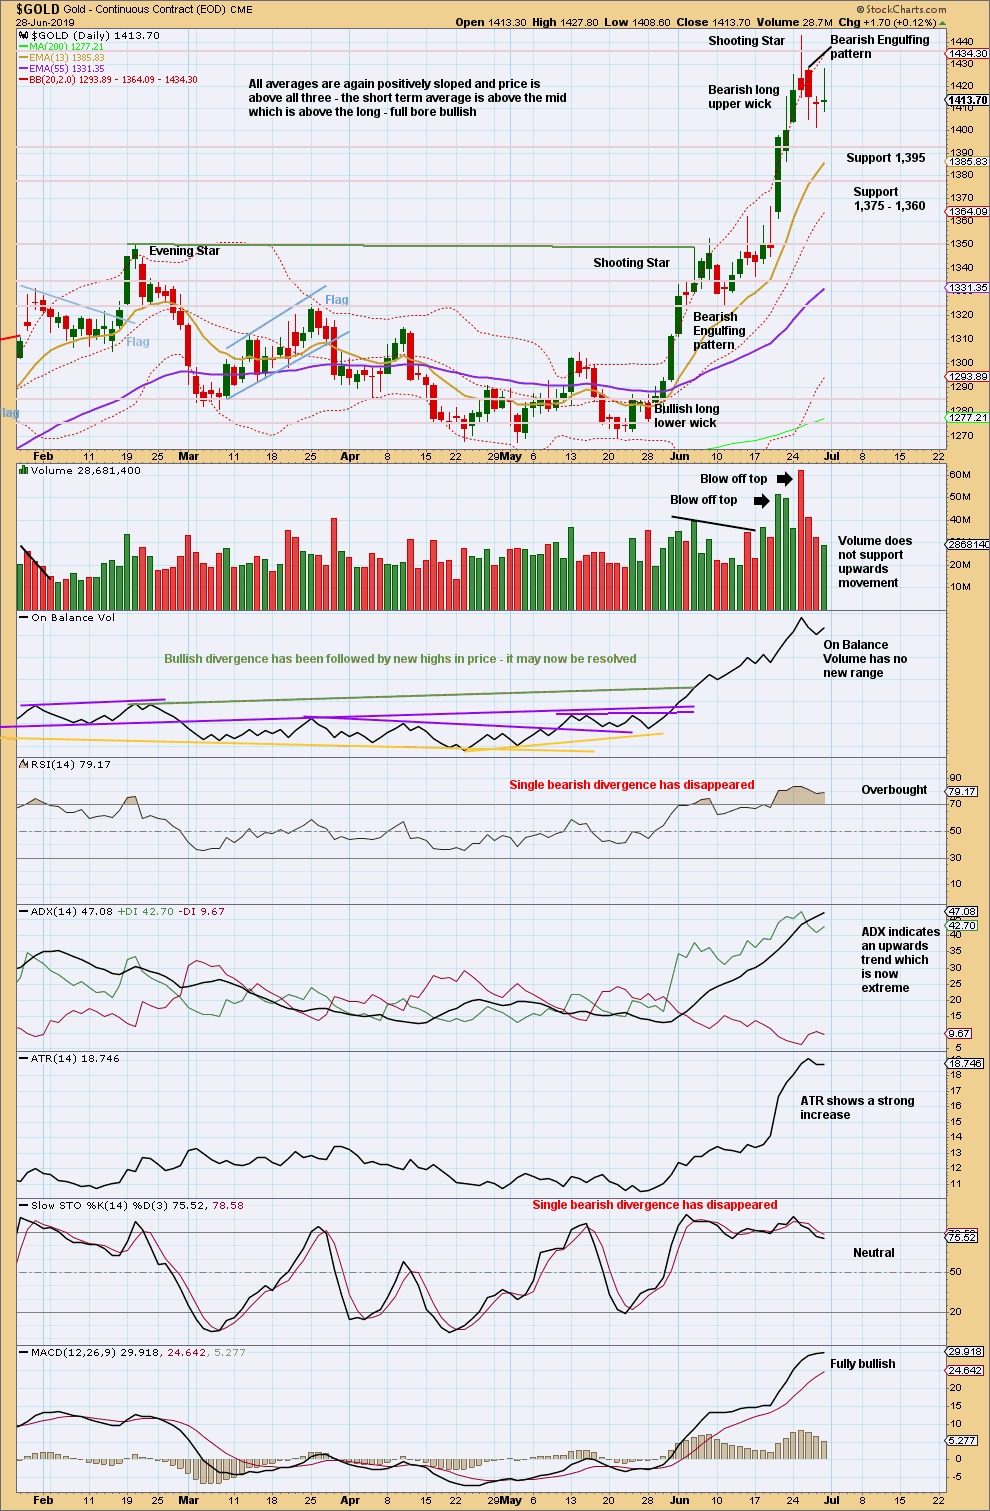
Gold has effected an upwards breakout above multi-year resistance and above the cyan bear market trend line. Look for next resistance identified on the chart.
WEEKLY CHART
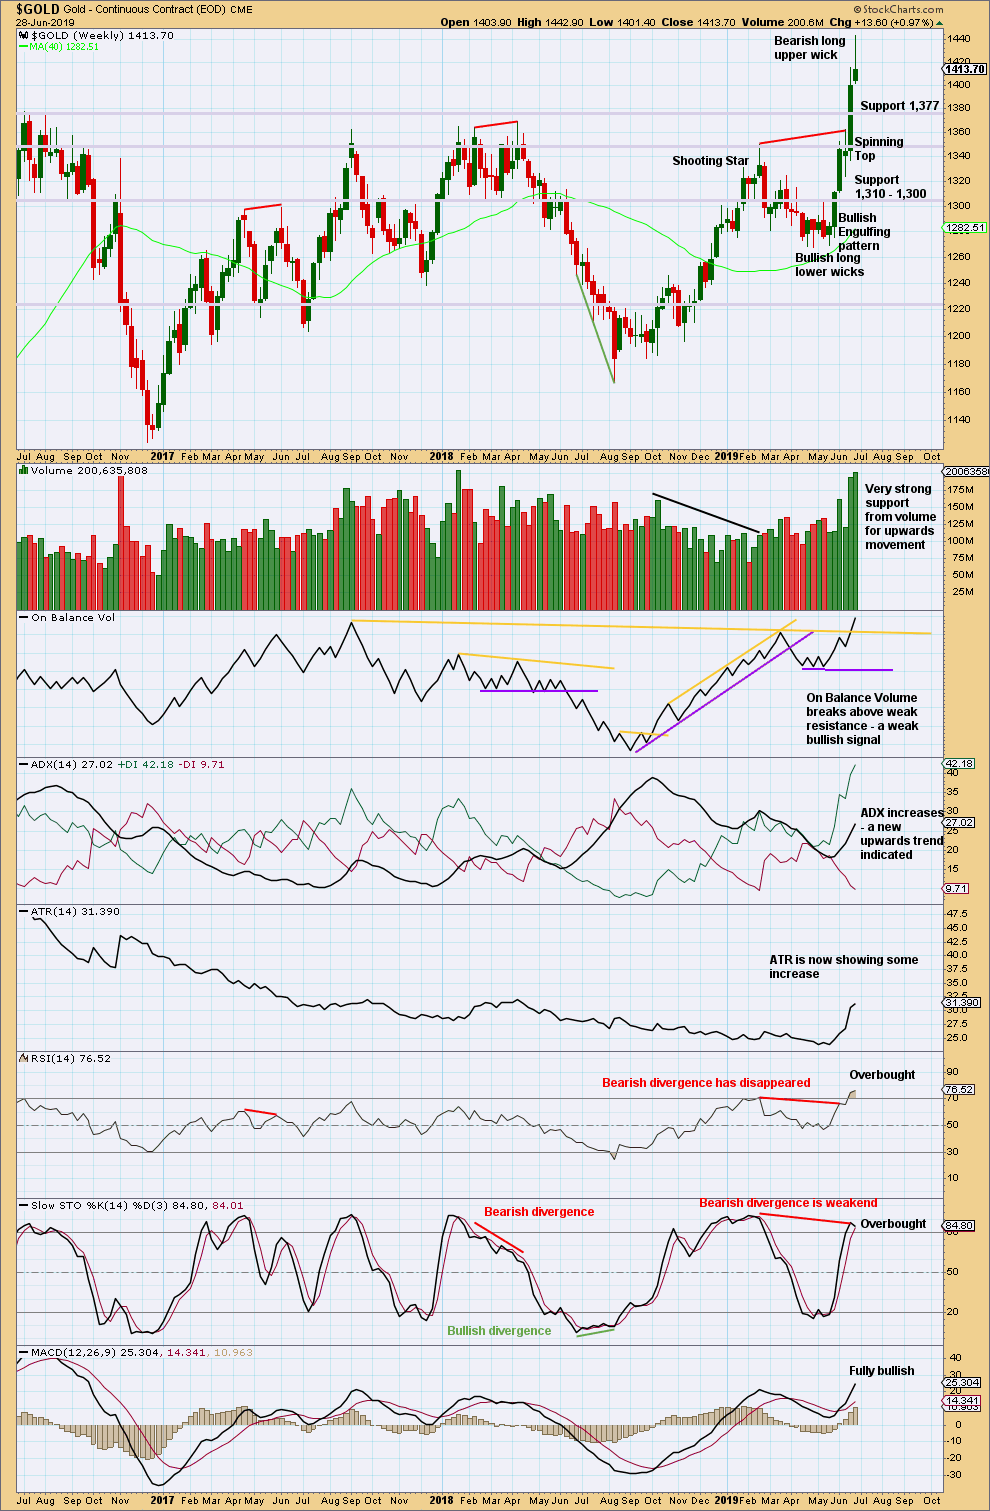
Click chart to enlarge. Chart courtesy of StockCharts.com.
Gold has broken out of a multi-year consolidation, which saw resistance about 1,375. The breakout has support from volume, so confidence may be had in it.
Price now has some strength with rising ATR. Conditions are overbought. A pullback or consolidation may begin here before the upwards trend resumes.
The bullish signal from On Balance Volume is weak only because the line breached had only 3 tests. However, it is a bullish signal and would tend to support the bullish Elliott wave count.
Look now for strong support about 1,375 for a possible back test.
DAILY CHART
Click chart to enlarge. Chart courtesy of StockCharts.com.
After the upwards breakout, it would be typical to see price curve back down to test support at prior resistance. Extreme overbought conditions may be relieved by a back test.
There are now two bearish candlestick reversal patterns. Look in the first instance for a test of support about 1,395 and below that about 1,375. Weak volume today for upwards movement within Friday’s session supports the idea of a back test continuing towards support early next week.
GDX WEEKLY CHART
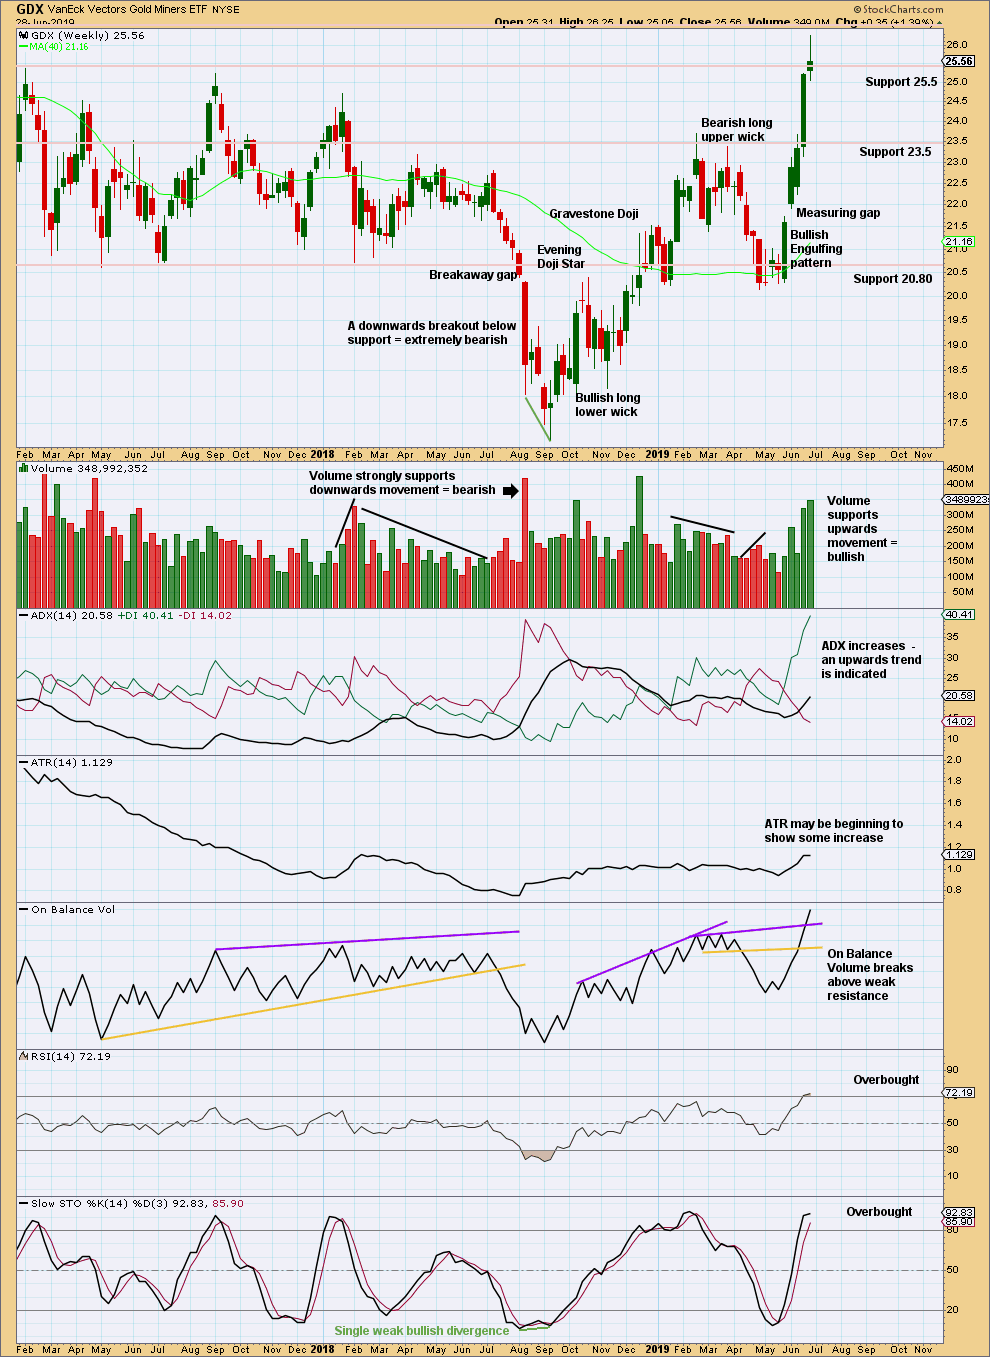
Click chart to enlarge. Chart courtesy of StockCharts.com.
The upwards trend continues, but conditions are now overbought. This can continue for a while during a strong trend. At this stage, there are no signs of a reversal.
GDX DAILY CHART
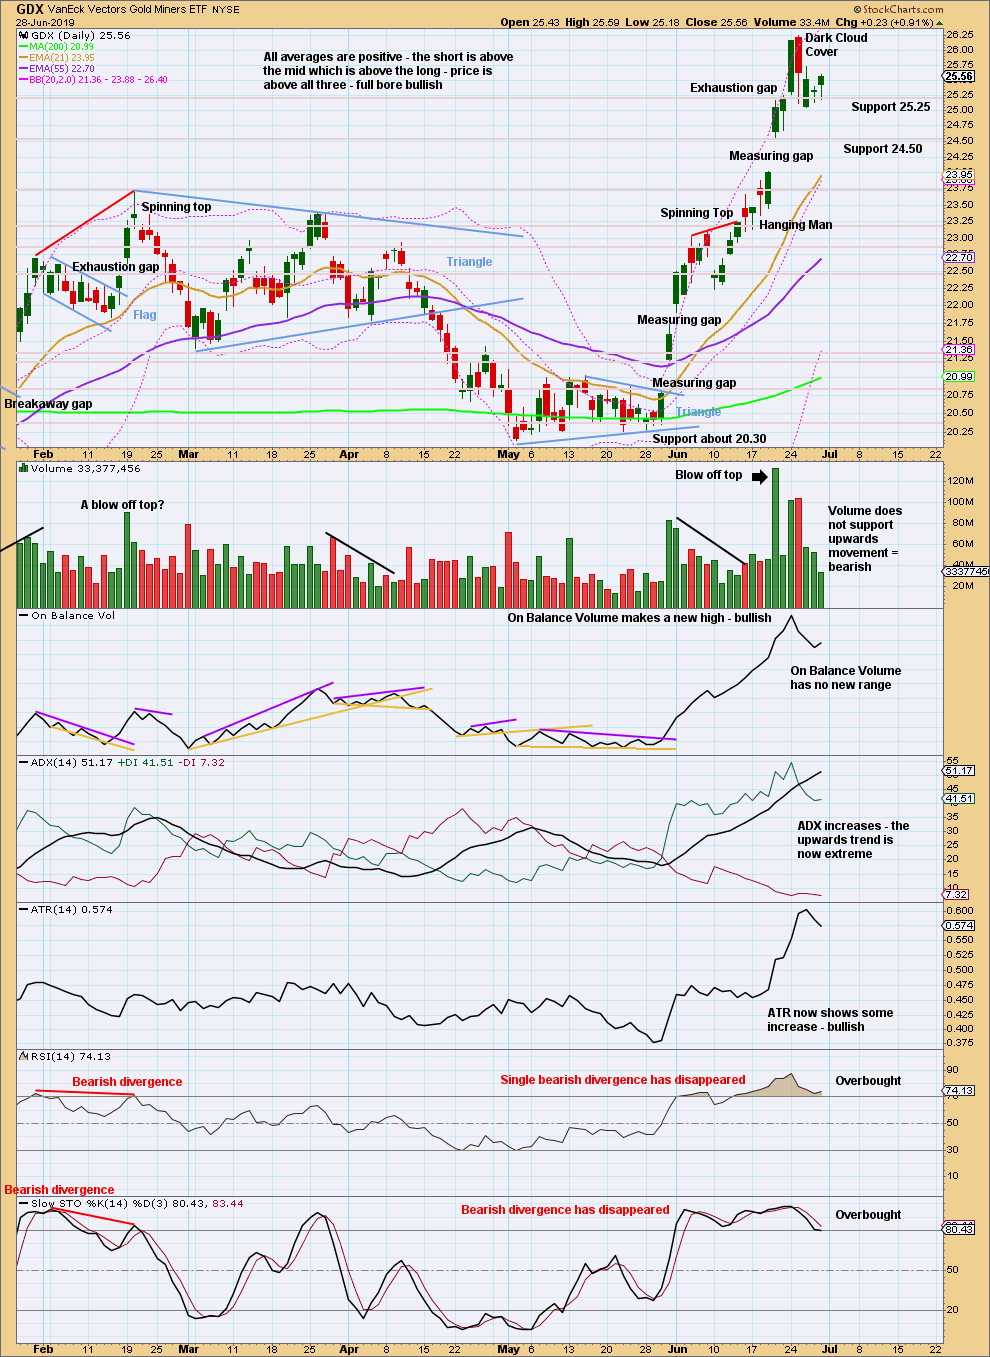
Click chart to enlarge. Chart courtesy of StockCharts.com.
The last gap is closed, so it is now renamed an exhaustion gap. This indicates the possibility of a trend change. In conjunction with a bearish candlestick reversal pattern in the Dark Cloud Cover, a trend change here may be reasonably likely.
A trend change may be either a 180 degree reversal, or equally as likely a change to sideways as price consolidates to relieve extreme conditions, before continuing the upwards trend.
US OIL
Last week’s summary expected price to continue overall higher towards 60.53. The high for the week is at 59.93.
Summary: Some sideways or downwards movement may unfold next week for a B wave. Thereafter, an upwards movement may end if price comes up to reach the upper edge of the maroon Elliott channel on the daily and weekly charts.
The larger trend most likely still remains down. The final target is calculated at 10.72.
MAIN ELLIOTT WAVE COUNT
MONTHLY CHART
Click chart to enlarge.
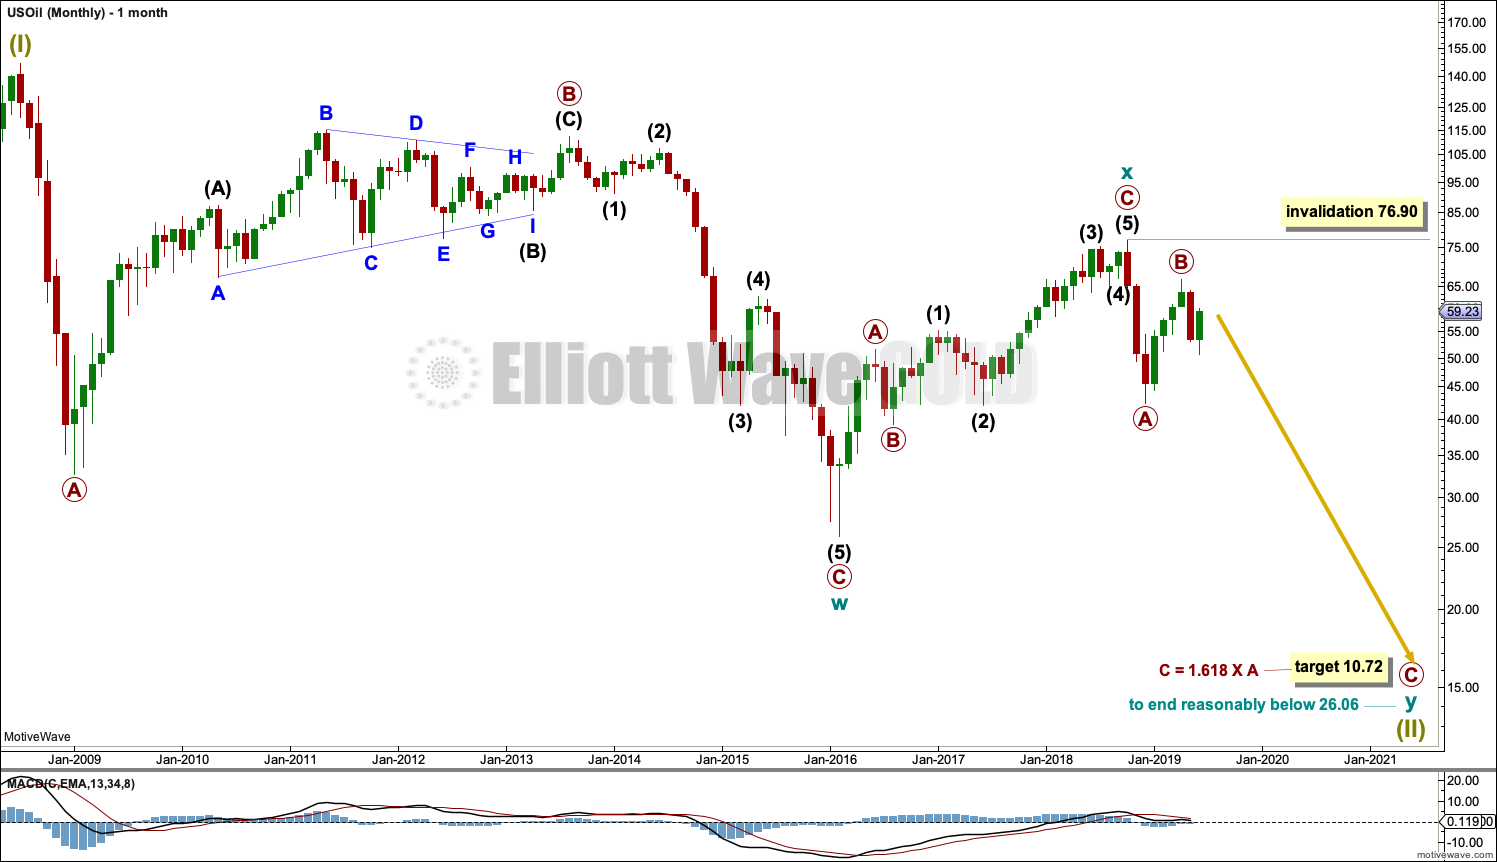
The basic Elliott wave structure is five steps forward and three steps back. This Elliott wave count expects that US Oil is still within a three steps back pattern, which began in July 2008. The Elliott wave count expects that the bear market for US Oil continues.
This Elliott wave corrective structure is a double zigzag, which is a fairly common structure. The correction is labelled Super Cycle wave (II).
The first zigzag in the double is complete and labelled cycle wave y. The double is joined by a three in the opposite direction labelled cycle wave x, which subdivides as a zigzag. The second zigzag in the double may now have begun, labelled cycle wave w.
The purpose of a second zigzag in a double zigzag is to deepen the correction when the first zigzag does not move price deep enough. To achieve this purpose cycle wave y may be expected to move reasonably below the end of cycle wave w at 26.06. The target calculated would see this expectation met.
Cycle wave y is expected to subdivide as a zigzag, which subdivides 5-3-5.
Cycle wave w lasted 7.6 years and cycle wave x lasted 2.7 years. Cycle wave y may be expected to last possibly about a Fibonacci 5 or 8 years.
If it continues higher, then primary wave B may not move beyond the start of primary wave A above 76.90.
The upwards wave labelled cycle wave x would have to be counted as a five wave impulse to see US Oil as within a new bull market. Such a wave count could be made but would look forced. This wave subdivides best as a three.
WEEKLY CHART
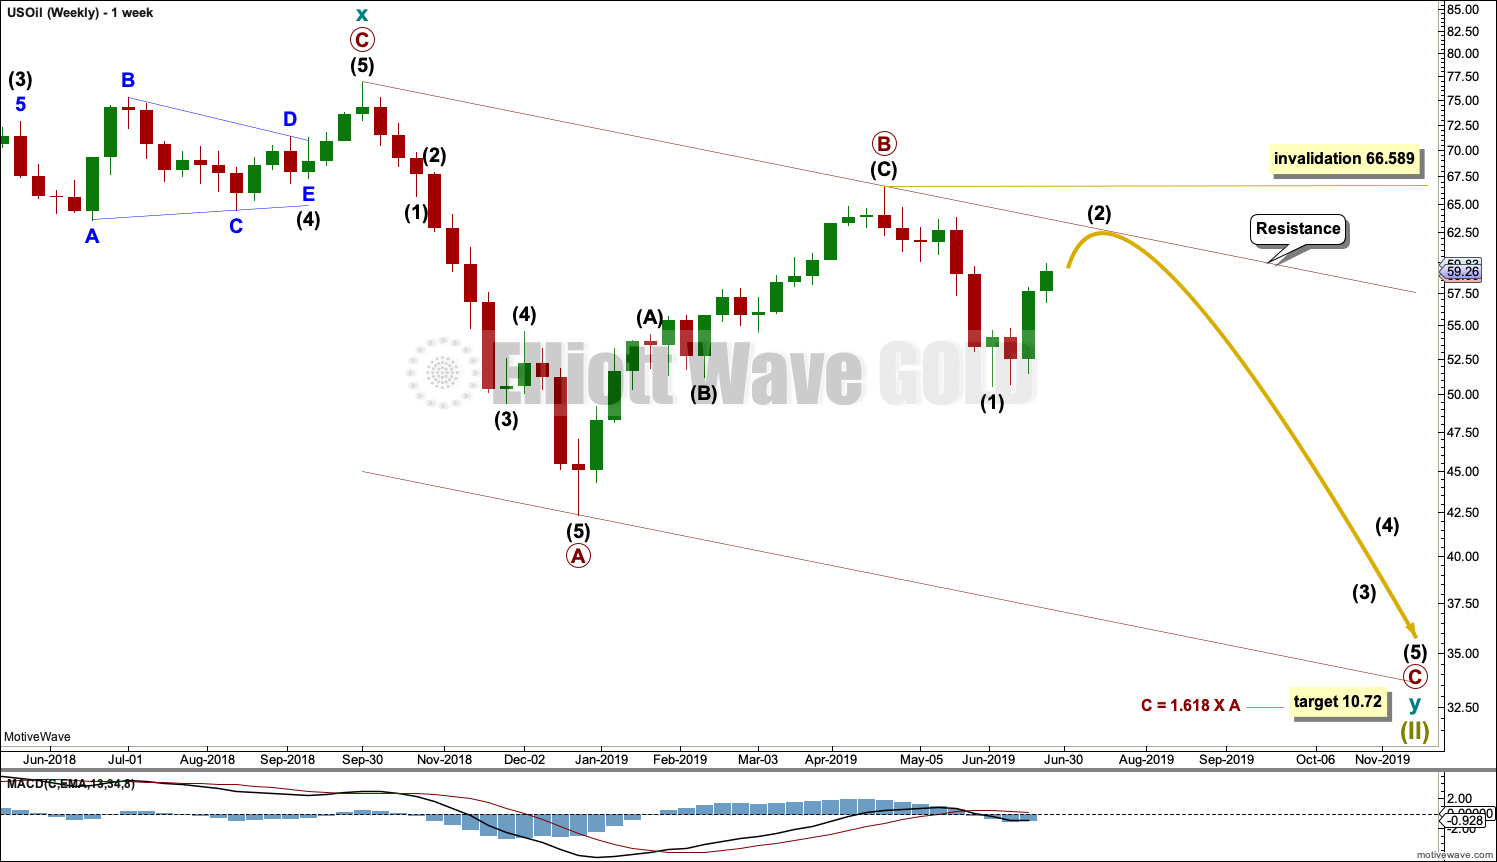
Click chart to enlarge.
This weekly chart is focussed on the start of cycle wave y.
Cycle wave y is expected to subdivide as a zigzag. A zigzag subdivides 5-3-5. Primary wave A must subdivide as a five wave structure if this wave count is correct.
Primary wave A may be a complete five wave impulse at the last low.
Primary wave B may now be a complete single zigzag at the last high.
Primary wave C may have just begun. Primary wave C must subdivide as a five wave structure.
Primary wave A lasted 12 weeks, just one short of a Fibonacci 13.
Primary wave C may be longer in time as well as price. If cycle wave y lasts a Fibonacci 5 years, then primary wave C within it may take as long as a Fibonacci 233 weeks.
Intermediate wave (1) within primary wave C may be a complete impulse. Intermediate wave (2) may not move beyond the start of intermediate wave (1) above 66.59.
Draw a channel about the zigzag of primary wave y using Elliott’s technique for a correction. Draw the first trend line from the start of primary wave A to the end of primary wave B, then place a parallel copy on the end of primary wave A. The upper edge of this channel may show where bounces along the way down find resistance. The lower edge of the channel may provide support.
Intermediate wave (2) may be a multi-week bounce that may find resistance at the upper edge of the Elliott channel.
DAILY CHART
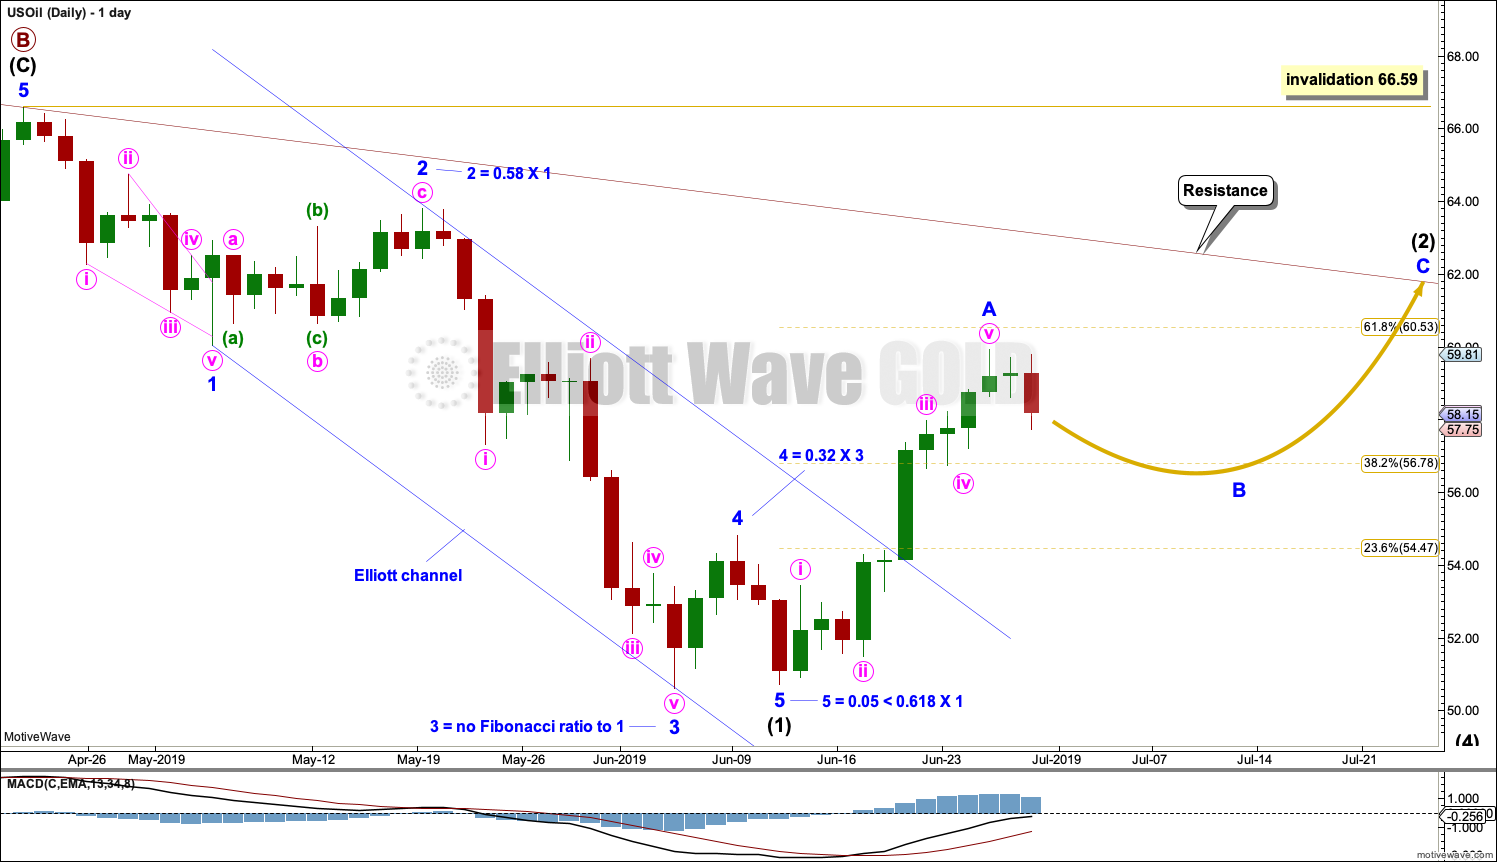
Click chart to enlarge.
Note that monthly and weekly charts are on a semi-log scale, but this daily chart is on an arithmetic scale. This makes a slight difference to trend channels.
It is possible that intermediate wave (1) is complete. Minor wave 4 for this wave count exhibits some alternation to minor wave 2; minor wave 2 may be a relatively deep zigzag or flat, and minor wave 4 may be a more shallow zigzag.
Minor wave 5 ends with a slight 0.11 truncation. This reduces the probability of this wave count, but with the other possibility on the daily chart this week discarded this wave count now looks the most likely scenario.
Intermediate wave (2) would most likely unfold as a zigzag and may end either about the 0.618 Fibonacci ratio of intermediate wave (1) or about the upper edge of the maroon Elliott channel. Intermediate wave (2) may continue for another one to two weeks.
Intermediate wave (2) may not move beyond the start of intermediate wave (1) above 66.59.
Within the zigzag of intermediate wave (2), minor wave A may now be a complete five wave impulse and minor wave B may now unfold sideways or lower as any one of more than 23 possible Elliott wave corrective structures. If minor wave A is correctly labelled as a five, then minor wave B may not move beyond its start below 50.72.
TECHNICAL ANALYSIS
MONTHLY CHART
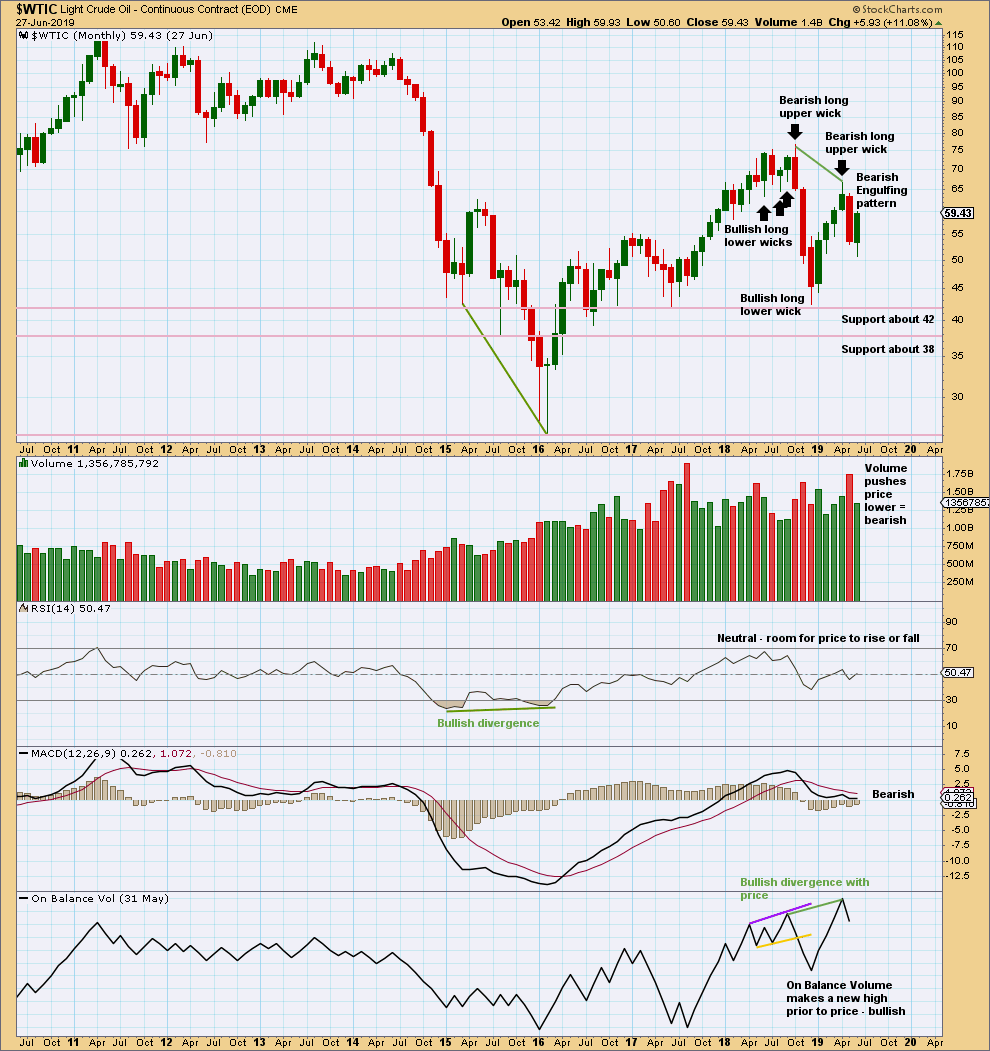
Click chart to enlarge. Chart courtesy of StockCharts.com.
May has closed with a strong Bearish Engulfing candlestick pattern, which has strong support from volume. This supports the Elliott wave count.
WEEKLY CHART
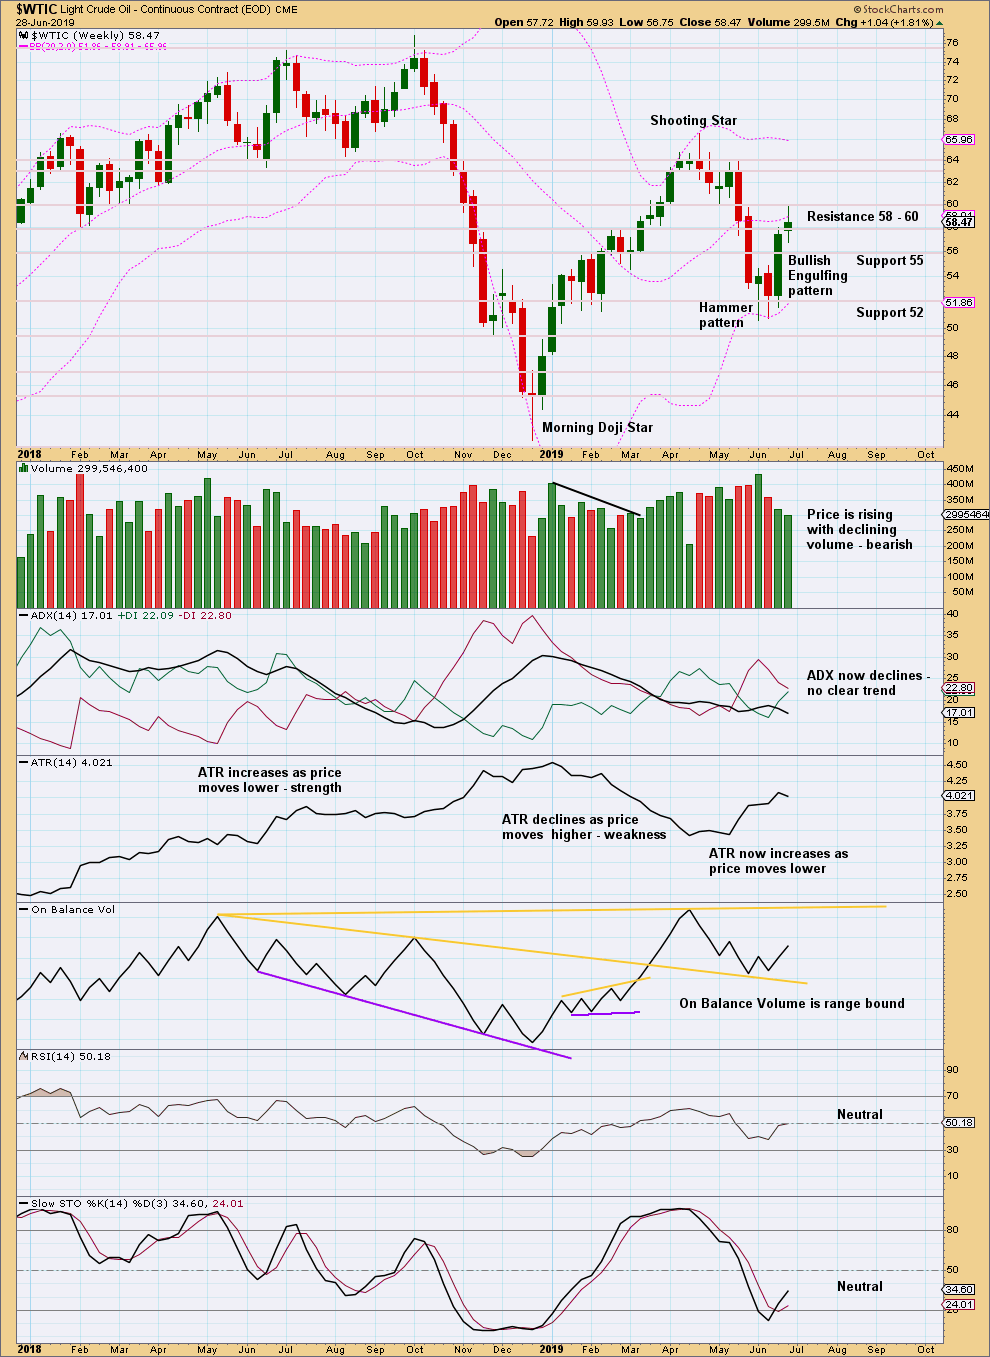
Click chart to enlarge. Chart courtesy of StockCharts.com.
A smaller range week with weak volume suggests upwards movement may be limited here. This bounce looks like a counter trend movement.
DAILY CHART
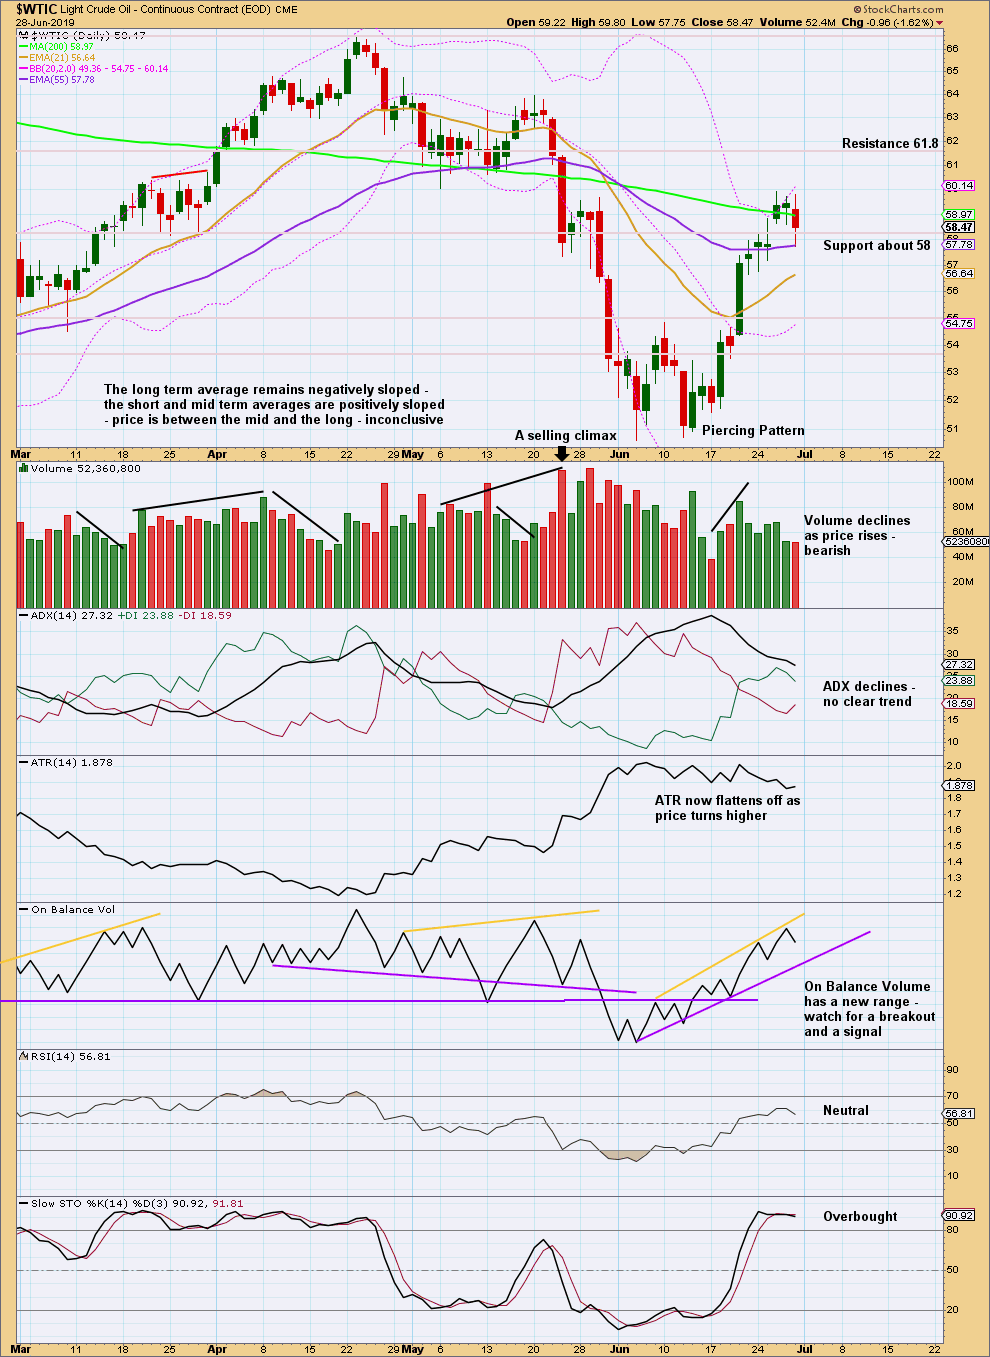
Click chart to enlarge. Chart courtesy of StockCharts.com.
Declining volume and flat ATR as price rises suggest this is a counter trend movement.
Stochastics is now overbought. This upwards bounce may now be limited.
—
Always practice good risk management as the most important aspect of trading. Always trade with stops and invest only 1-5% of equity on any one trade. Failure to manage risk is the most common mistake new traders make.
Update for US Oil:
Minor B may be complete. A target zone is calculated for minor C to end intermediate (2) and a channel is drawn about intermediate (2).
While price remains within the channel assume the count is correct and intermediate (2) is continuing higher.
If the channel is breached by downwards movement (before a new high above 59.93) then minor B may be continuing lower and the count within intermediate (2) would need to be relabelled.
For gold, I’ve continued to build my long positions, and I’m actually leaning heavily into silver right now too.
Although we haven’t tested down to 1375, we did test the 1381/1382 level multiple times in the last day, and it appears gold is being bid under 1400.
You could argue that today offered a perfect opportunity to see gold continue to sell-off (market stable, no real news), but yet it is rising.
With lower volumes expected the remainder of the week, and the payroll data coming out Friday, I expect the rise to continue to 1500 very quickly. My belief is payroll data will confirm the rate cut in July.
Last, I would love to see silver start outperforming too. If we are in the bullish scenario, then I believe we’ll see $28 silver by early next year.
Corey
Drastically cut my long positioning while still marginally profitable. Playing wait and see now as both counts are clearly on table. Gold and silver also love to make their yearly lows in August. Not what I was expecting to end week. Have a great weekend everyone!
Hi Lara
Thanks for visiting the US and I hope you had a good trip back home to New Zealand.
When you come out of jet lag would you consider the following scenario for the S&P?
We are currently in intermediate wave 1 of primary wave 3. Minor wave 1 of intermediate wave 1 ended on or about 6/10. Minor wave 2 ended on or about 6/14. Minor wave 3 ended on 6/21 and minor wave 4 ended 6/26. I wouldn’t bet on those exact dates but their close. If I’m doing this right, minor wave 3 is slightly longer than minor wave 1 so minor 5 (which just started on 6/26 or about then) can be extended.
This would mean we still have intermediate wave 3, 4 and 5 to go in primary wave 3. This might jive with the bull continuing longer which jives with continued strength in the AD line. And not necessarily ending before 2020.
Anyway, I’ll be interested in your response. This is my first attempt at doing wave analysis so don’t be too hard on me. Just kidding.
Thanks for everything as always
Rich
That makes minor 1 length 181.80 points and minor 3 length 89.47 points.
3 is still shorter than 1.
The wave count fits, and looks fairly good on the daily chart. For the short term it’s fairly bearish in expecting intermediate (1) probably over at the last high and intermediate (2) probably still to unfold a fair bit lower for a few days.
It doesn’t resolve the problem that on the monthly chart cycle III is quite a bit shorter than cycle I, and so it still has a limit at 3,477.39.
My interpretation was that we were in minor wave 5 of intermediate wave 1 with intermediate wave 2 yet to begin.
I’m obviously a novice at this
Thanks so much
Rich
That’s okay. I have a hard time following a description of a wave count which has a bunch of numbers and / or dates. A chart is so much easier.
Hi Lara,
As a Canadian, with Gold breaking out on June 19th in US dollars (which I am finding to be the most significant event in the past 5 years), I am very concerned with the possible devaluation of the US dollar going forward against other currencies like the Canadian dollar.
With my clients, I am starting to move out of the US because the S&P 500 in Canadian dollars (see attached) might have completed its Super Cycle wave V… We are also starting to accumulate gold and gold stocks as they are starting to outperform overall in the markets.
I did attempt to do an Elliott wave count on the monthly chart of the S&P 500 CDN $… Let me know when you have a chance if it seems accurate.
I would imagine it would affect you as well since you are in NZ and the NZ dollar has been increasing lately…
All the best to you and I appreciate all you do.
Mathieu
Hi Mathiew. That wave count looks good. I’d move the degree of labelling within the very last red 5 within teal V down one degree and see it as only just completed wave 1 within a five wave impulse. The invalidation point is then the start of red 5 at 32. A new low below that point indicates a potential trend change, but there are alternate wave counts at that stage that could be correct. A new all time high would give support to the bull market, obviously.
I’d also play with drawing a channel about teal V to contain all of it. Start with Elliott’s first technique; the first trend line from the ends of waves 1 to 3, a parallel copy on the end of wave 2. If that’s not a good fit then adjust to fit better.
Thanks Lara… appreciate it.
Hi Mathiew,
This index in free version of StockCharts shows only daily and weekly. You have posted the monthly, so you must have the paid version.
If I may bother you, what is the monthly RSI value showing for this index, please?
Thank you kindly.
Yes… I have a member of stockcharts.com for more than a decade…
The monthly RSI for $SPX:$CDW is 62.65 as of Friday.
Mathieu
Thank you very much. Appreciate your help.