

S&P 500
The week has ended strongly. A low was called tentatively on the 3rd of June, and the first confidence point at 2,799 was passed on the next day. Thereafter, price has continued higher this week as expected.
Summary: The low of December 2018 is expected to most likely remain intact.
The pullback may have ended. A new target for a third wave up is at 3,104.
The alternate wave count considers the possibility that a relatively short lived bear market may have begun. The target is at 2,080. This wave count has a fairly low probability, but it is a possibility that must be acknowledged. This possibility may now be discarded with a new high above 2,892.15.
The biggest picture, Grand Super Cycle analysis, is here.
Monthly charts were last published here, with video here. There are two further alternate monthly charts here. Video is here.
ELLIOTT WAVE COUNTS
The first two Elliott wave counts below will be labelled First and Second. They may be about of even probability. When the fifth wave currently unfolding on weekly charts may be complete, then these two wave counts will diverge on the severity of the expected following bear market. To see an illustration of this future divergence monthly charts should be viewed.
The alternate Elliott wave count has a very low probability.
FIRST WAVE COUNT
WEEKLY CHART
Click chart to enlarge.
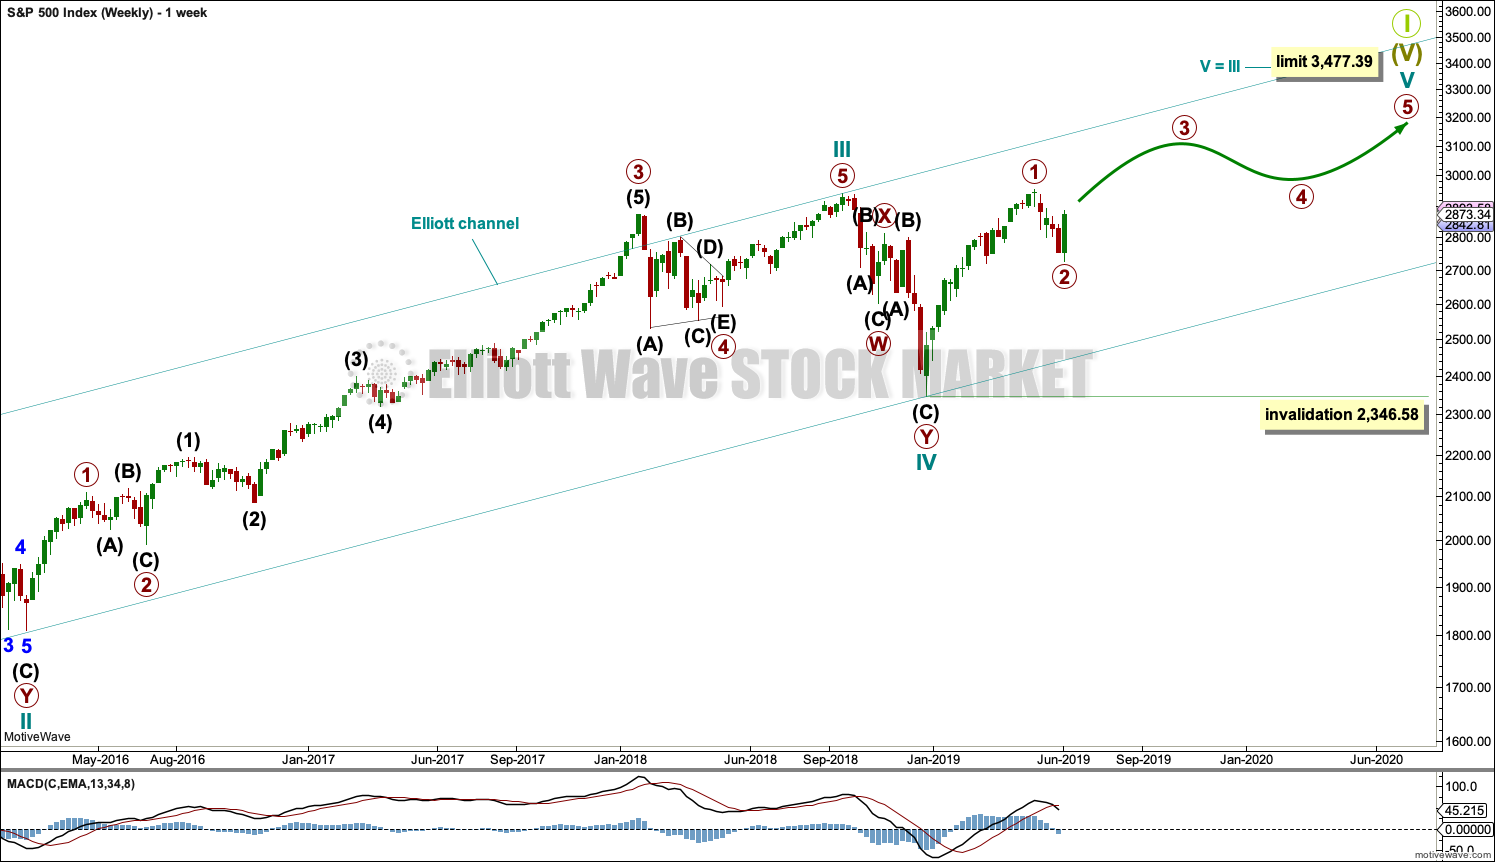
The basic Elliott wave structure consists of a five wave structure up followed by a three wave structure down (for a bull market). This wave count sees the bull market beginning in March 2009 as an incomplete five wave impulse and now within the last fifth wave, which is labelled cycle wave V. This impulse is best viewed on monthly charts. The weekly chart focusses on the end of it.
Elliott wave is fractal. This fifth wave labelled cycle wave V may end a larger fifth wave labelled Super Cycle wave (V), which may end a larger first wave labelled Grand Super Cycle wave I.
The teal Elliott channel is drawn using Elliott’s first technique about the impulse of Super Cycle wave (V). Draw the first trend line from the end of cycle wave I (off to the left of the chart, the weekly candlestick beginning 30th November 2014) to the end of cycle wave III, then place a parallel copy on the end of cycle wave II. This channel perfectly shows where cycle wave IV ended at support. The strongest portion of cycle wave III, the end of primary wave 3, overshoots the upper edge of the channel. This is a typical look for a third wave and suggests the channel is drawn correctly and the way the impulse is counted is correct.
Within Super Cycle wave (V), cycle wave III is shorter than cycle wave I. A core Elliott wave rule states that a third wave may never be the shortest. For this rule to be met in this instance, cycle wave V may not be longer in length than cycle wave III. This limit is at 3,477.39.
The structure of cycle wave V is focussed on at the daily chart level below.
Within cycle wave V, primary wave 2 may not move beyond the start of primary wave 1 below 2,346.58.
In historic analysis, two further monthly charts have been published that do not have a limit to upwards movement and are more bullish than this wave count. Members are encouraged to consider those possibilities (links below summary) alongside the wave counts presented on a daily and weekly basis.
DAILY CHART
Click chart to enlarge.
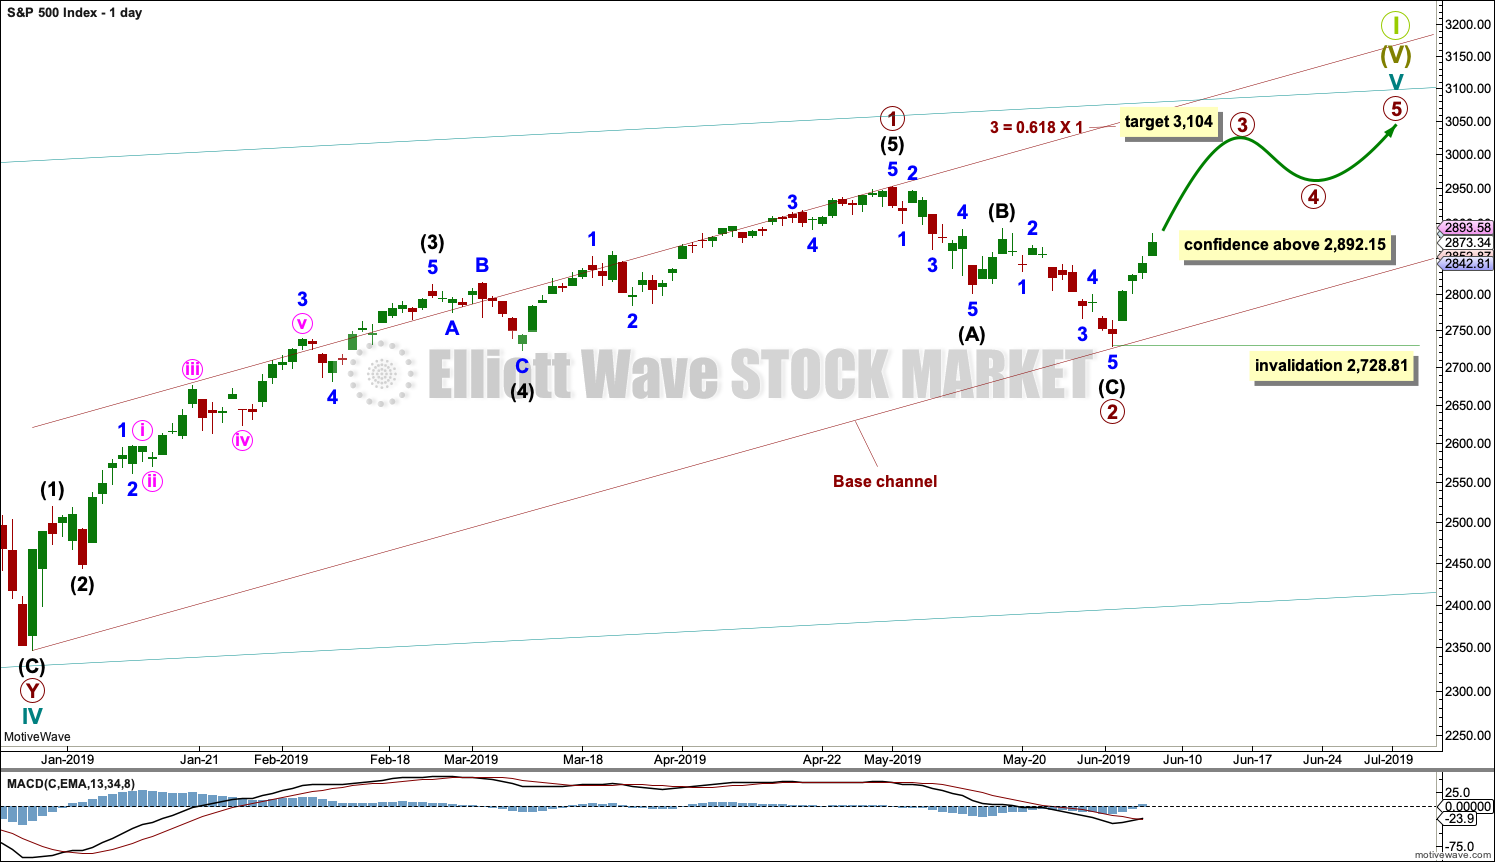
Cycle wave V must subdivide as a five wave motive structure. Within that five wave structure, primary waves 1 and 2 may be complete.
Primary wave 3 must move above the end of primary wave 1. Primary wave 3 may only subdivide as an impulse. Within the impulse, no second wave correction may move beyond the start of its first wave below 2,728.81.
When primary wave 3 is over, then primary wave 4 may be a shallow sideways consolidation that may not move into primary wave 1 price territory below 2,954.13.
Thereafter, primary wave 5 should move above the end of primary wave 3 to avoid a truncation.
A base channel is drawn about primary waves 1 and 2. The lower edge is drawn from the start of primary wave 1 to the end of primary wave 2, then a parallel copy is placed upon the high of primary wave 1. Along the way up, corrections within primary wave 3 may find support about the lower edge of the base channel. Primary wave 3 may have the power to break above the upper edge of the channel.
At this stage, a new high above 2,892.15 would invalidate the alternate wave count below and offer some confidence to this wave count.
SECOND WAVE COUNT
WEEKLY CHART
Click chart to enlarge.
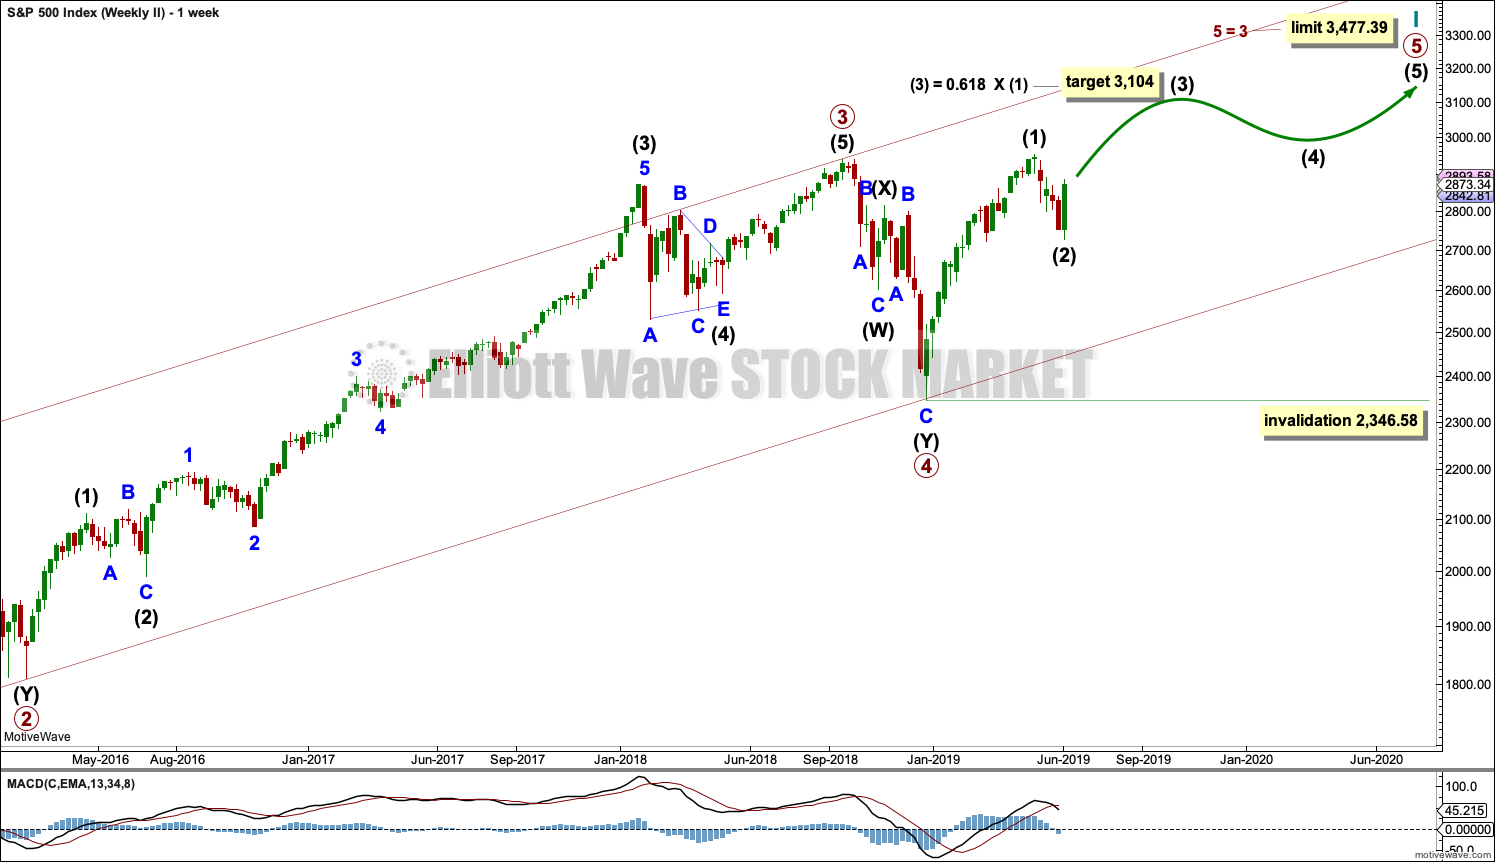
This weekly chart is almost identical to the first weekly chart, with the sole exception being the degree of labelling.
This weekly chart moves the degree of labelling for the impulse beginning in March 2009 all down one degree. This difference is best viewed on monthly charts.
The impulse is still viewed as nearing an end; a fifth wave is still seen as needing to complete higher. This wave count labels it primary wave 5.
ALTERNATE WAVE COUNT
WEEKLY CHART
Click chart to enlarge.
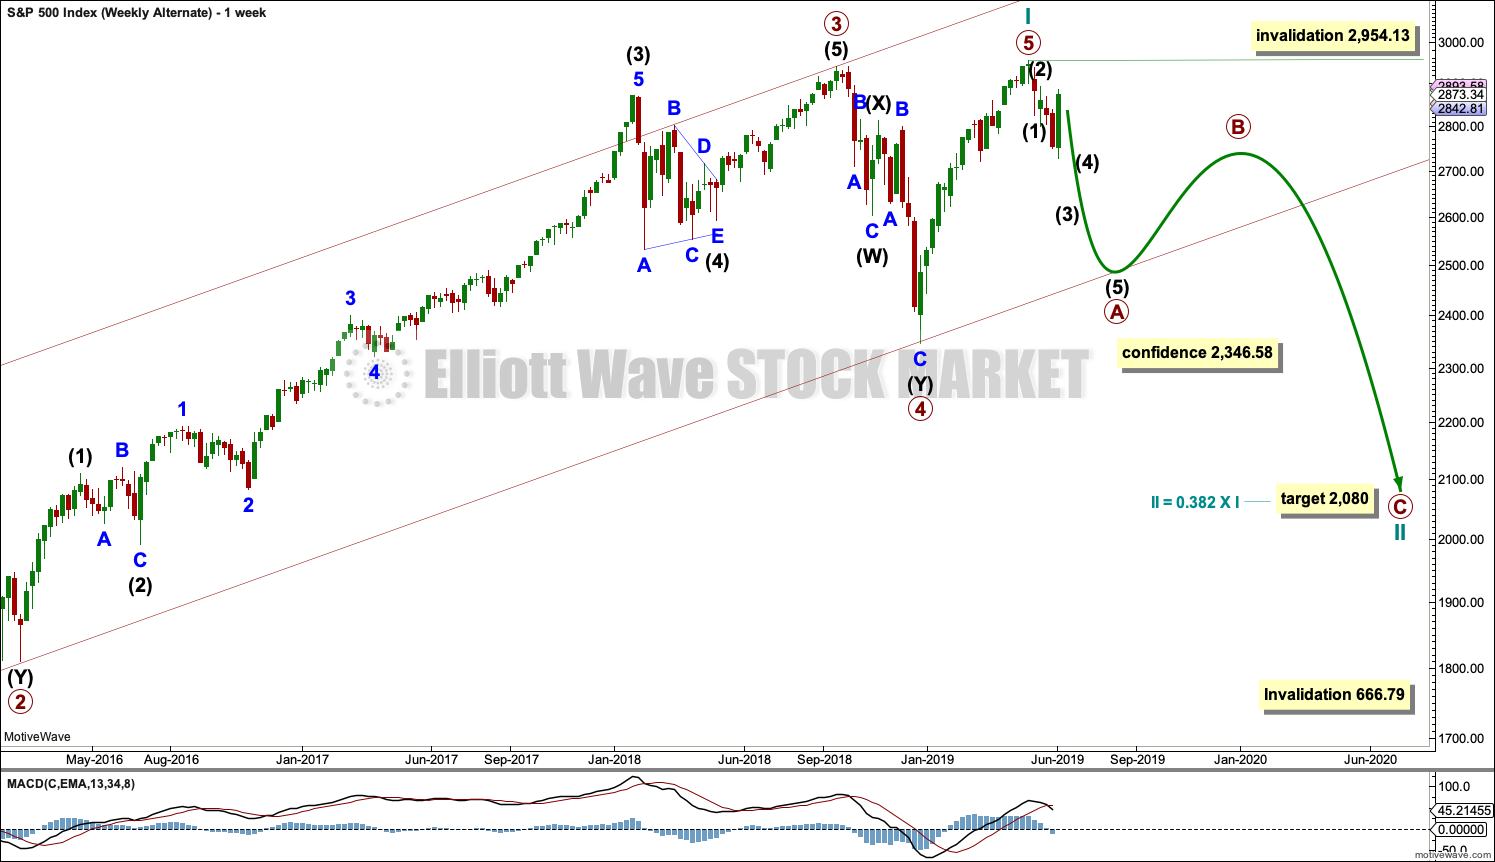
It is possible that for the second wave count cycle wave I could be complete. Primary wave 5 may be seen as a complete five wave impulse on the daily chart.
If cycle wave I is complete, then cycle wave II may meet the definition of a bear market with a 20% drop in price at its end.
Within cycle wave I, primary wave 1 was a very long extension and primary wave 3 was shorter than primary wave 1 and primary wave 5 was shorter than primary wave 3. Because primary wave 1 was a long extension cycle wave II may end within the price range of primary wave 2, which was from 2,132 to 1,810. The 0.382 retracement of cycle wave I is within this range.
Cycle wave II may not move beyond the start of cycle wave I below 666.79.
This wave count does not have support at this time from classic technical analysis.
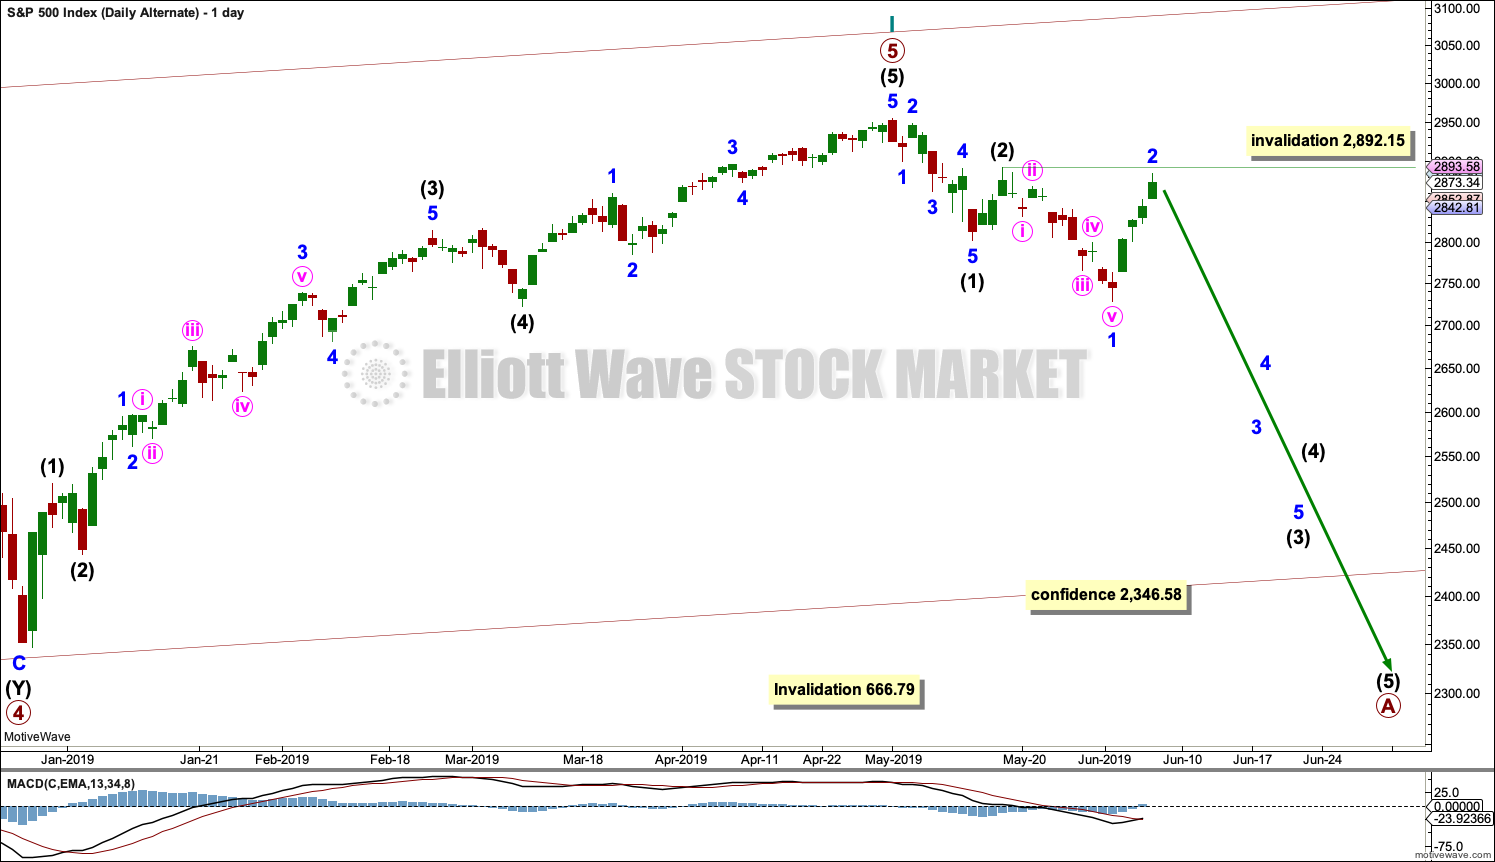
DAILY CHART
Click chart to enlarge.
The most likely structure for cycle wave II would be a zigzag. Within a zigzag, primary wave A would subdivide as a five wave structure, most likely an impulse. Within the impulse of primary wave A, so far intermediate waves (1) and (2) may be complete and intermediate wave (3) has moved below the end of intermediate wave (1) and may be incomplete.
Intermediate wave (3) would reach 1.618 the length of intermediate wave (1) at 2,645.
Intermediate wave (3) may only subdivide as an impulse. Within the impulse, minor wave 1 may be complete. Minor wave 2 may not move beyond the start of minor wave 1 above 2,892.15. At this stage, a new high above this point would see this alternate wave count discarded. This week the size of minor wave 2 gives this wave count the wrong look.
Within the zigzag, primary wave B may not move beyond the start of primary wave A.
TECHNICAL ANALYSIS
WEEKLY CHART
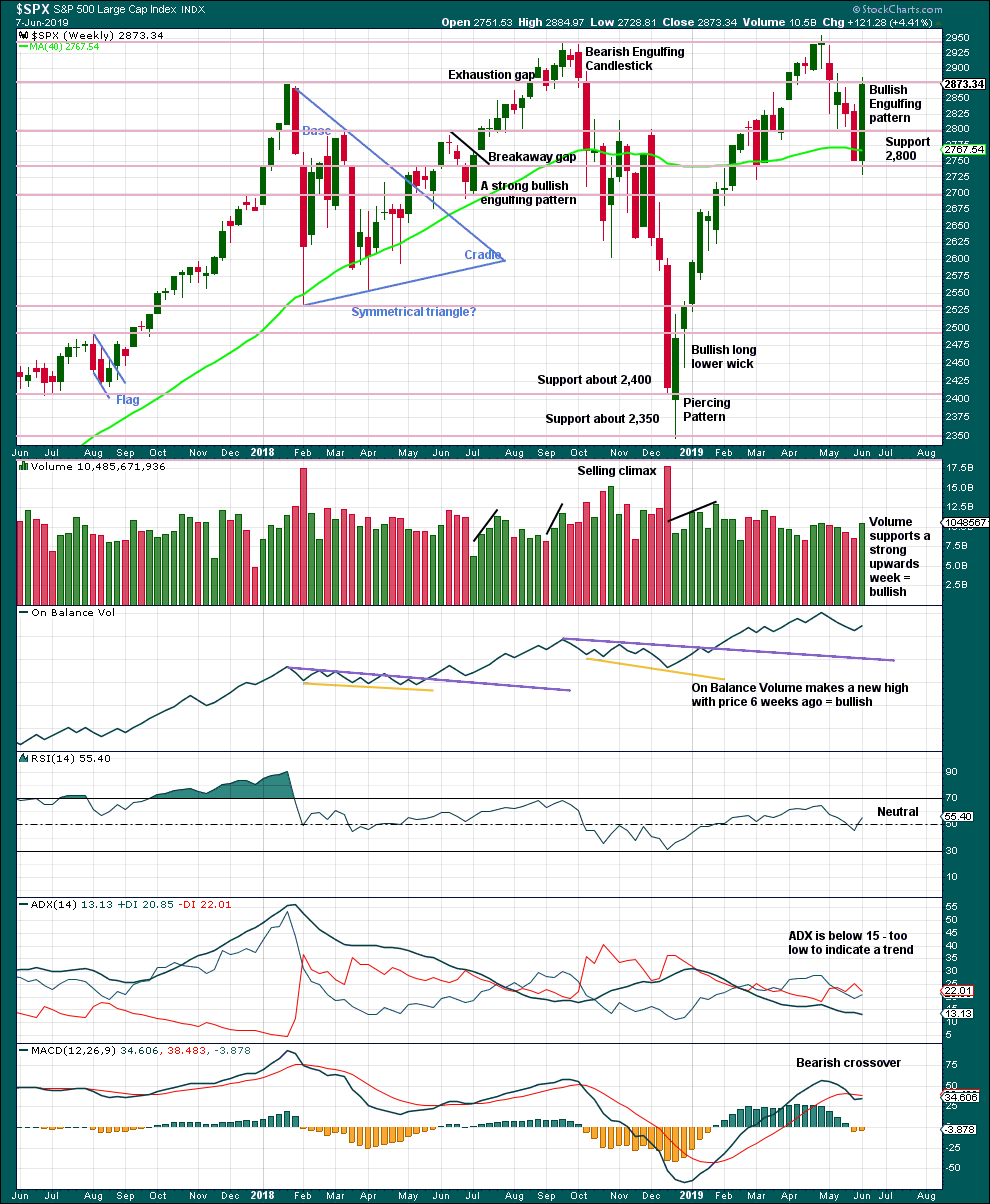
Click chart to enlarge. Chart courtesy of StockCharts.com.
Weight will be given in this analysis to the strong bullish reversal pattern, which has support from volume. This supports the main Elliott wave counts.
DAILY CHART
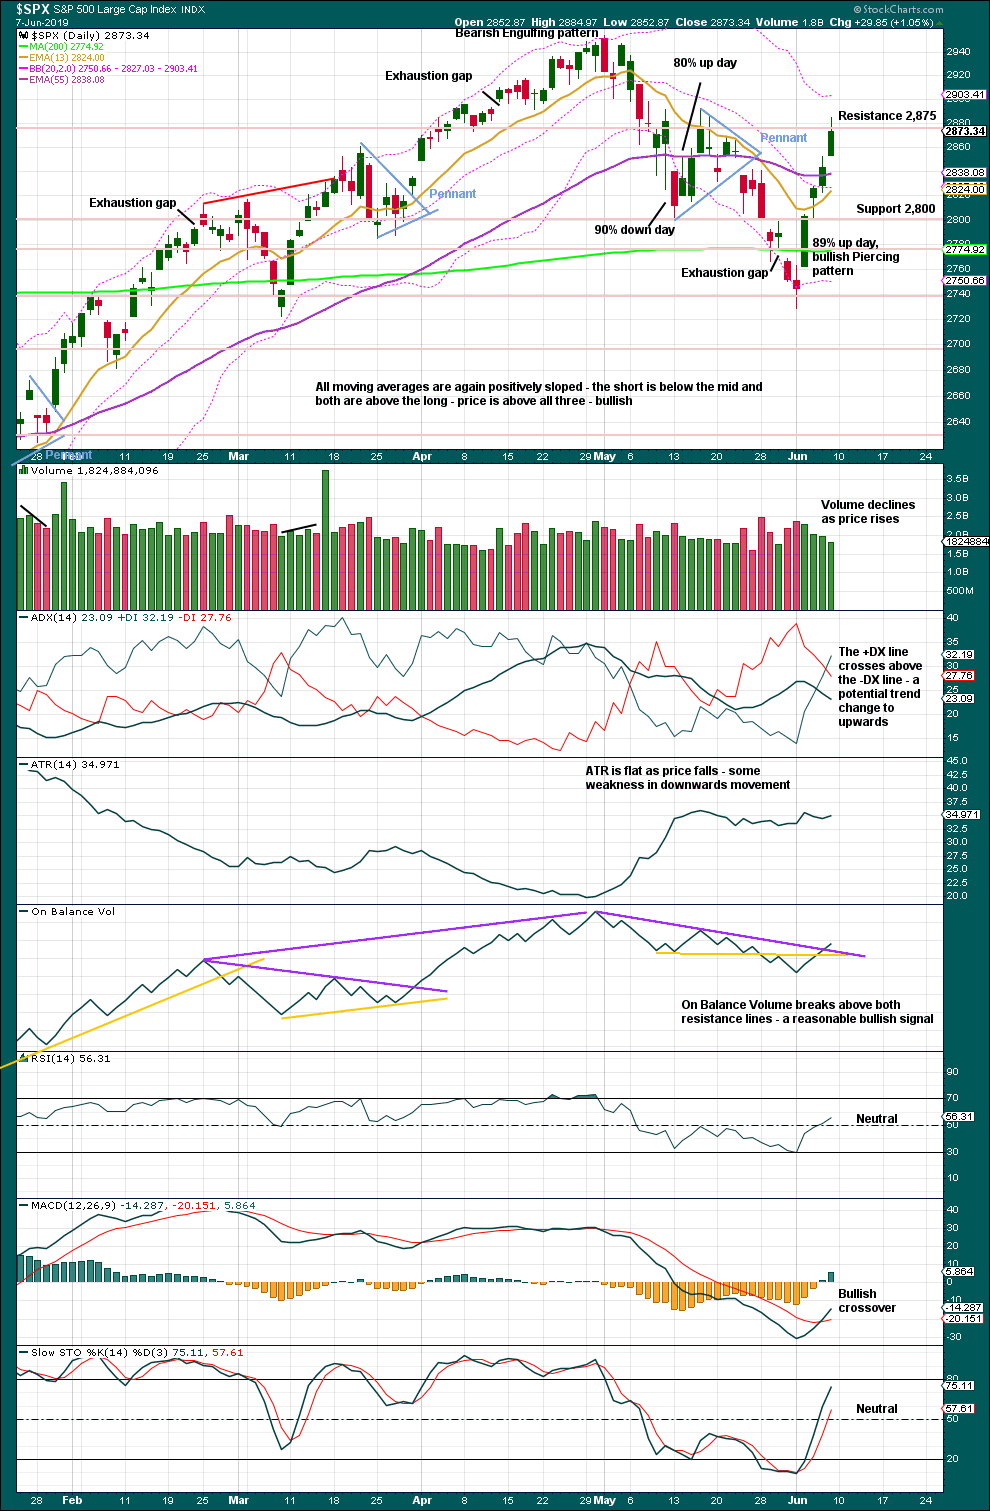
Click chart to enlarge. Chart courtesy of StockCharts.com.
Declining to flat ATR as price falls supports the first two Elliott wave counts and indicates the alternate looks less likely.
The bullish signal from On Balance Volume supports the main Elliott wave count.
Little weight will be given to some decline in volume at the daily chart level as this has been a feature of this market for some time yet price continues higher.
BREADTH – AD LINE
WEEKLY CHART
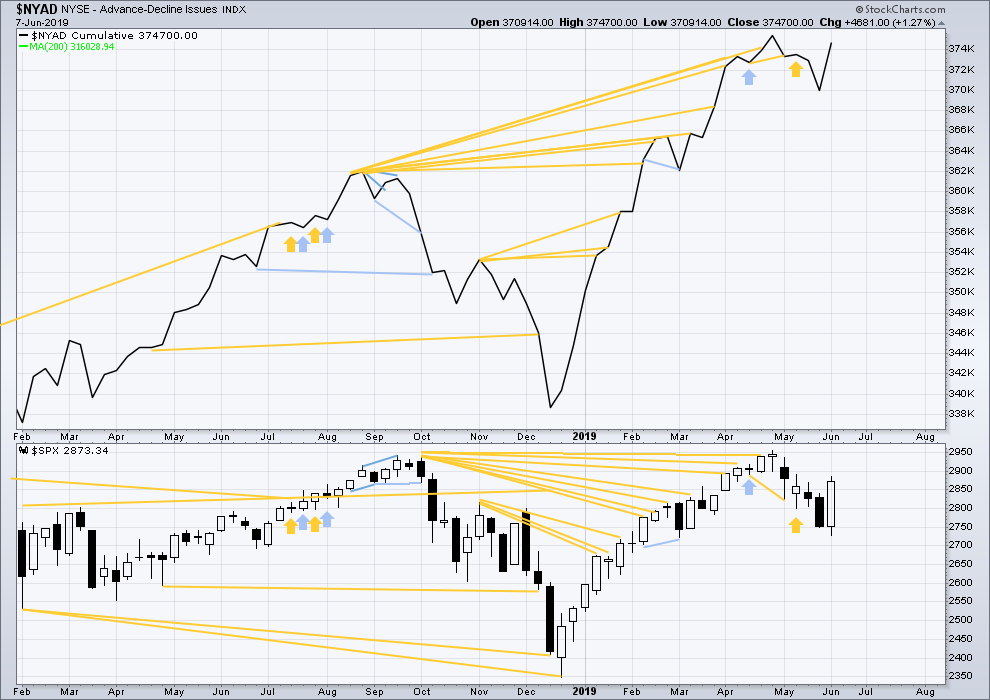
Click chart to enlarge. Chart courtesy of StockCharts.com. So that colour blind members are included, bearish signals
will be noted with blue and bullish signals with yellow.
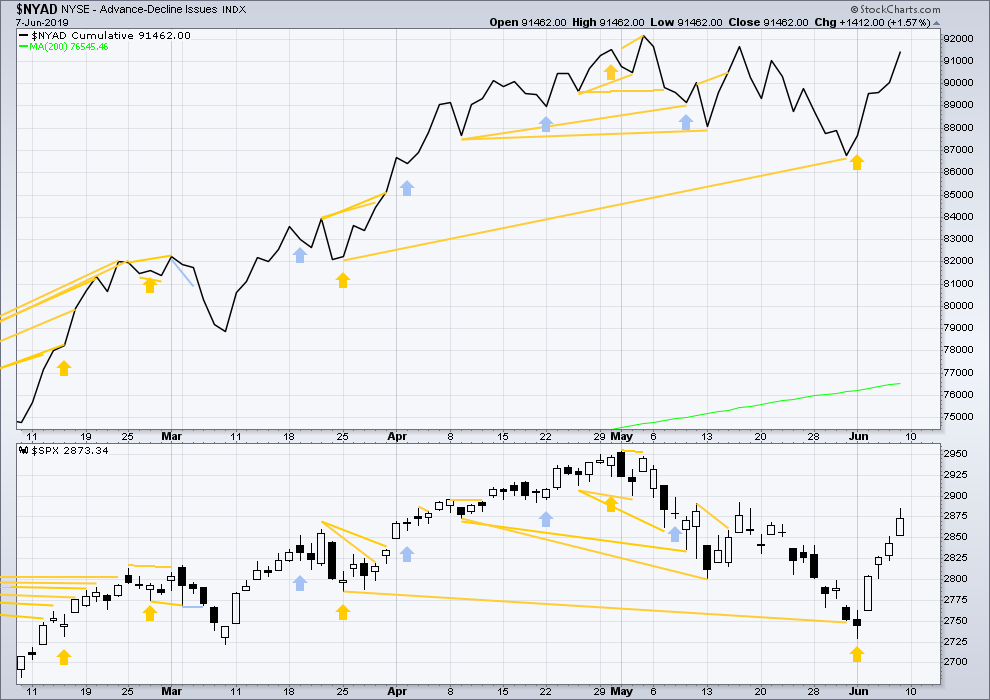
Bear markets from the Great Depression and onwards have been preceded by an average minimum of 4 months divergence between price and the AD line with only two exceptions in 1946 and 1976. With the AD line making a new all time high on the 3rd of May, the end of this bull market and the start of a new bear market is very likely a minimum of 4 months away, which is the beginning of September 2019.
In all bear markets in the last 90 years there is some positive correlation (0.6022) between the length of bearish divergence and the depth of the following bear market. No to little divergence is correlated with more shallow bear markets. Longer divergence is correlated with deeper bear markets.
If a bear market does develop here, it comes after no bearish divergence. It would therefore more likely be shallow. The alternate Elliott wave count outlines this potential scenario.
Price has moved higher this week. Upwards movement has normal support from rising breadth. There is no divergence.
All of small mid and large caps are moving higher. Large caps are strongest; this is normal for the later stages of a bull market.
DAILY CHART
Click chart to enlarge. Chart courtesy of StockCharts.com. So that colour blind members are included, bearish signals
will be noted with blue and bullish signals with yellow.
Breadth should be read as a leading indicator.
Both price and the AD line are again moving higher. The AD line is not moving faster or slower than price. Upwards movement has support from rising market breadth. There is no new divergence.
VOLATILITY – INVERTED VIX CHART
WEEKLY CHART
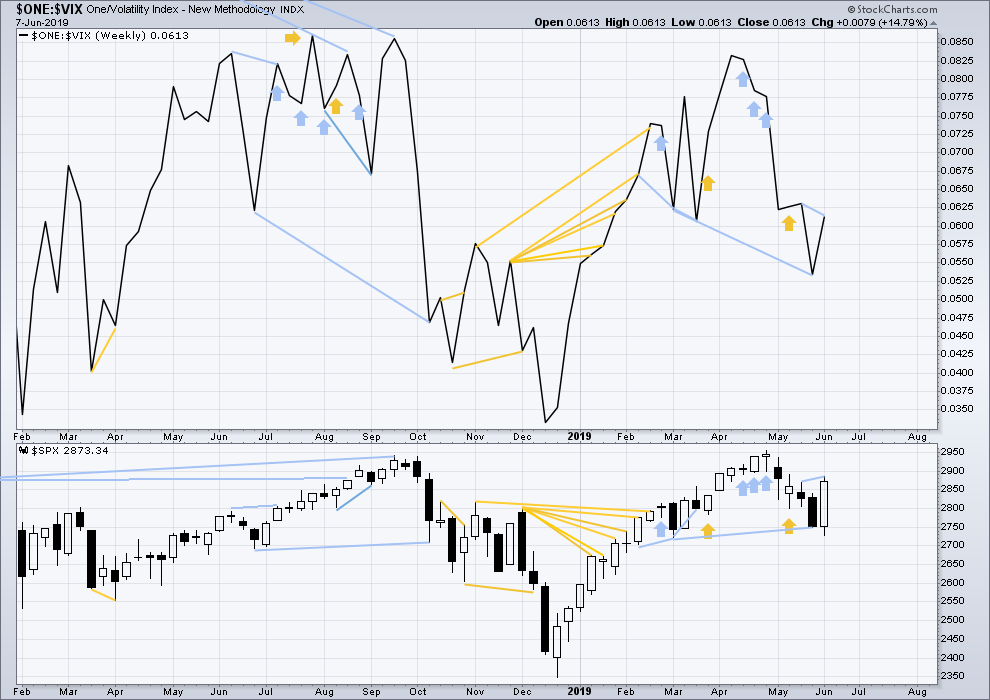
Click chart to enlarge. Chart courtesy of StockCharts.com. So that colour blind members are included, bearish signals
will be noted with blue and bullish signals with yellow.
Inverted VIX has made a new low below the low of the 4th of March, but price has not. Downwards movement comes with a strong increase in VIX, which is increasing faster than price. This divergence is bearish, but will not be given much weight in this analysis at this time.
This week price has made a new high above the high of two weeks ago, but inverted VIX has not. Price is rising faster than VIX is falling. This divergence is bearish for the short term.
DAILY CHART
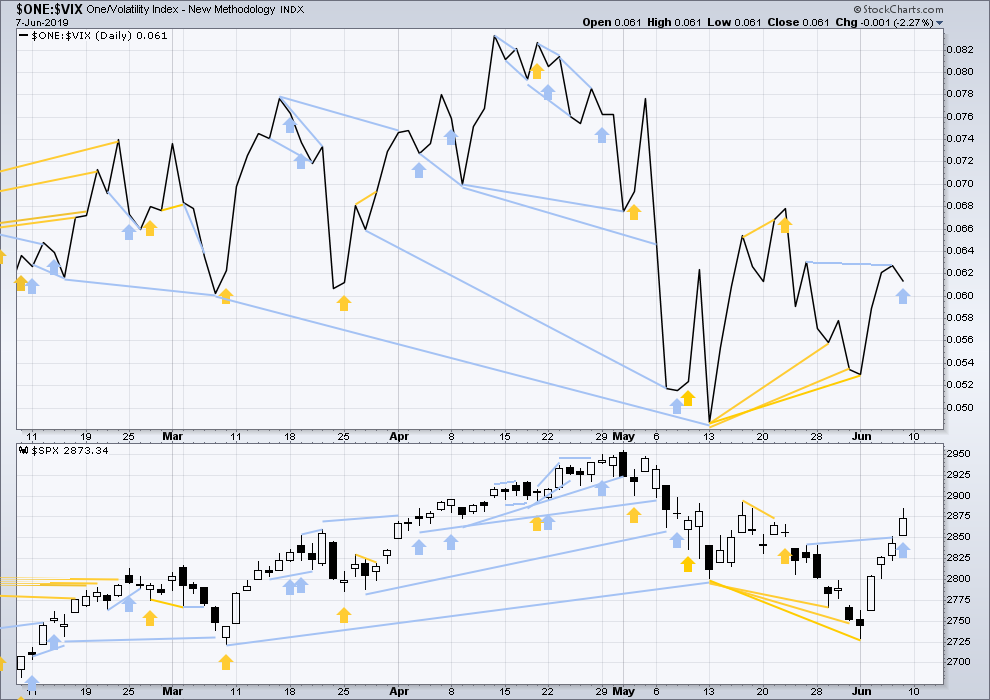
Click chart to enlarge. Chart courtesy of StockCharts.com. So that colour blind members are included, bearish signals
will be noted with blue and bullish signals with yellow.
Price has moved higher for Friday, but inverted VIX has moved lower. Upwards movement in price does not come with a normal corresponding decline in VIX. VIX has increased for the session. This divergence is bearish.
Bearish divergence between price and VIX has now developed to the point where it may be given some weight. It may be indicating a deeper pullback to begin soon, which may be intermediate wave (2) approaching.
DOW THEORY
Dow Theory confirmed a bear market in December 2018. This does not necessarily mean a bear market at Grand Super Cycle degree though; Dow Theory makes no comment on Elliott wave counts. On the 25th of August 2015 Dow Theory also confirmed a bear market. The Elliott wave count sees that as part of cycle wave II. After Dow Theory confirmation of a bear market in August 2015, price went on to make new all time highs and the bull market continued.
DJIA: 23,344.52 – a close on the 19th of December at 23,284.97 confirms a bear market.
DJT: 9,806.79 – price has closed below this point on the 13th of December.
S&P500: 2,532.69 – a close on the 19th of December at 2,506.96 provides support to a bear market conclusion.
Nasdaq: 6,630.67 – a close on the 19th of December at 6,618.86 provides support to a bear market conclusion.
With all the indices having moved higher following a Dow Theory bear market confirmation, Dow Theory would confirm a bull market if the following highs are made:
DJIA: 26,951.81
DJT: 11,623.58
S&P500: 2,940.91 – a new all time high has been made on the 29th of April 2019.
Nasdaq: 8,133.30 – a new high has been made on 24th of April 2019.
GOLD
A new high above 1,346.45 was expected for the main Elliott wave count, although some further consolidation was expected first.
Summary: This upwards trend is expected to end above 1,346.45 but not above 1,365.68. Along the way up, one more small multi day consolidation or shallow pullback for a fourth wave may have again just begun.
Grand SuperCycle analysis is here.
Last monthly charts are here. Video is here.
MAIN ELLIOTT WAVE COUNT
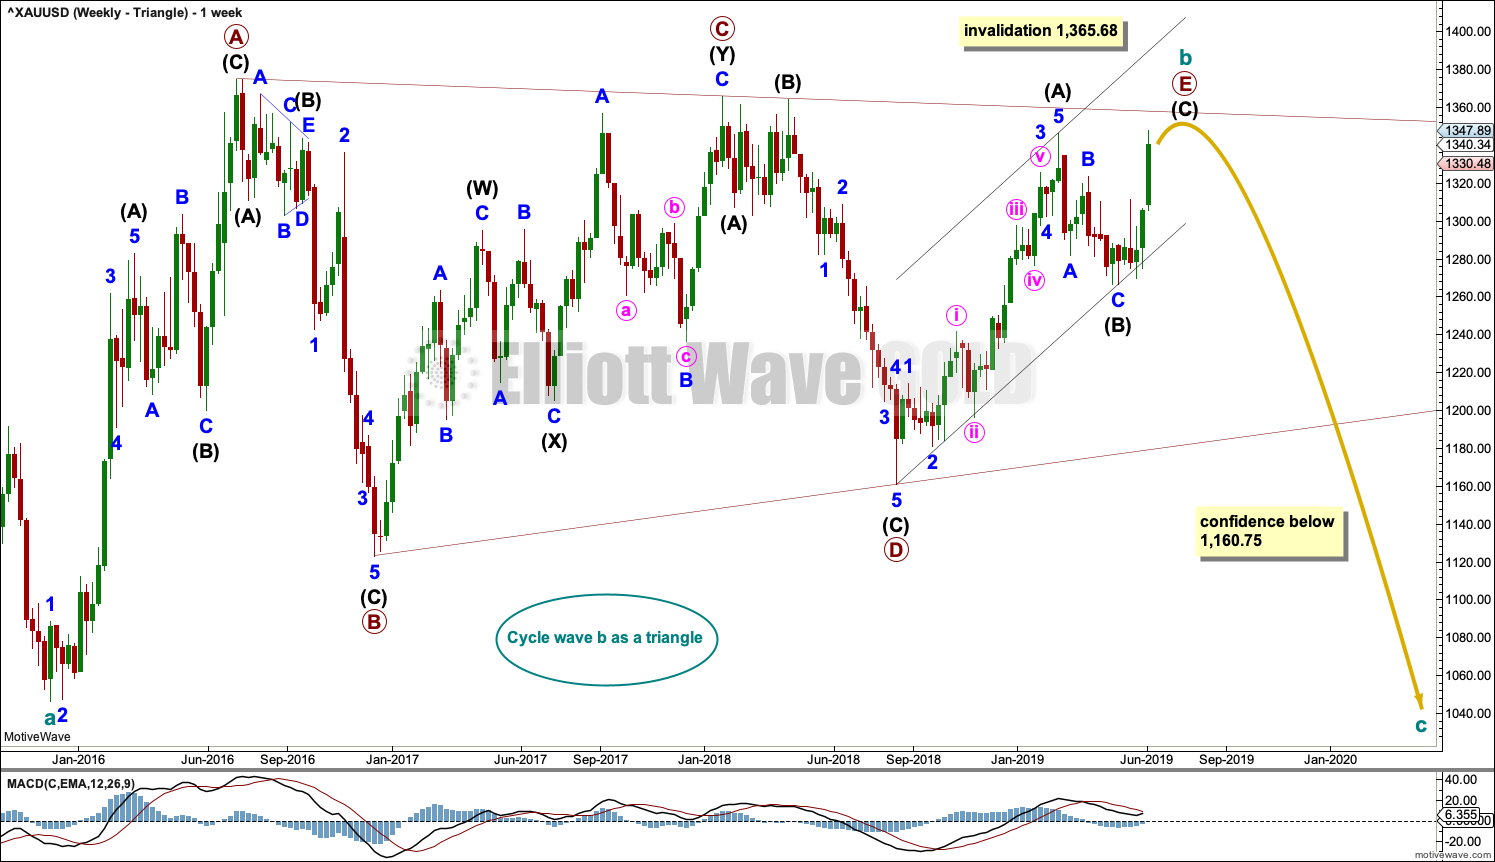
WEEKLY CHART – TRIANGLE
Click chart to enlarge.
The basic Elliott wave structure is five waves up followed by three waves back (in a bull market). At this time, the preferred Elliott wave count sees Gold as still within three waves back, which began at the all time high in September 2011.
Five waves up are labelled 1,2,3,4,5. Three waves back are labelled A,B,C.
This wave count sees Gold as now about two thirds through the three waves back. The three wave structure is labelled cycle waves a, b and c.
The triangle for cycle wave b may still be incomplete. The final sub-wave of primary wave E may be an incomplete zigzag. Within the zigzag of primary wave E, intermediate wave (C) has now made a slight new high above the end of intermediate wave (A). A truncation is now avoided; intermediate wave (C) could be over here or very soon indeed.
Primary wave E may either undershoot or overshoot the A-C trend line. Primary wave E may not move beyond the end of primary wave C above 1,365.68.
Draw a channel about the zigzag of primary wave E using Elliott’s technique. Draw the first trend line from the start of intermediate wave (A) to the end of intermediate wave (B), then place a parallel copy on the end of intermediate wave (A). Now that it is possible that intermediate wave (C) may be over, a breach of the channel by downwards movement would be a strong indication that the triangle for cycle wave b is over and cycle wave c downwards may then have just begun.
DAILY CHART – TRIANGLE
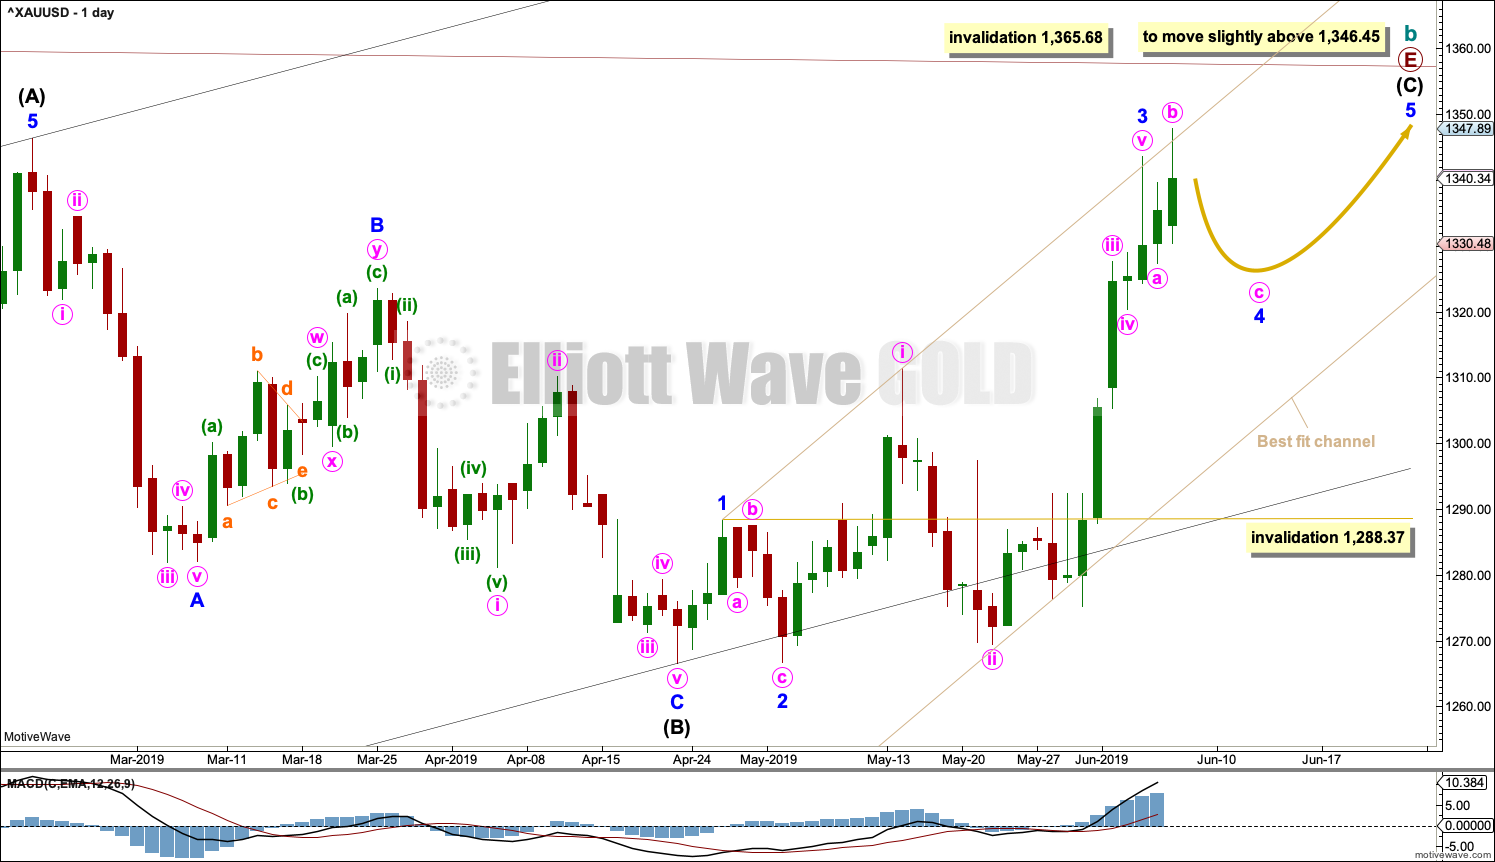
Click chart to enlarge.
The final zigzag of primary wave E must subdivide 5-3-5. Intermediate wave (C) must subdivide as a five wave motive structure, most likely an impulse.
Within the impulse of intermediate wave (C), minor waves 1 through to 3 may be complete.
Minor wave 4 may not move into minor wave 1 price territory below 1,288.37. Minor wave 4 may be expected to very likely be relatively brief and shallow.
DAILY CHART – TRIANGLE – ALTERNATE
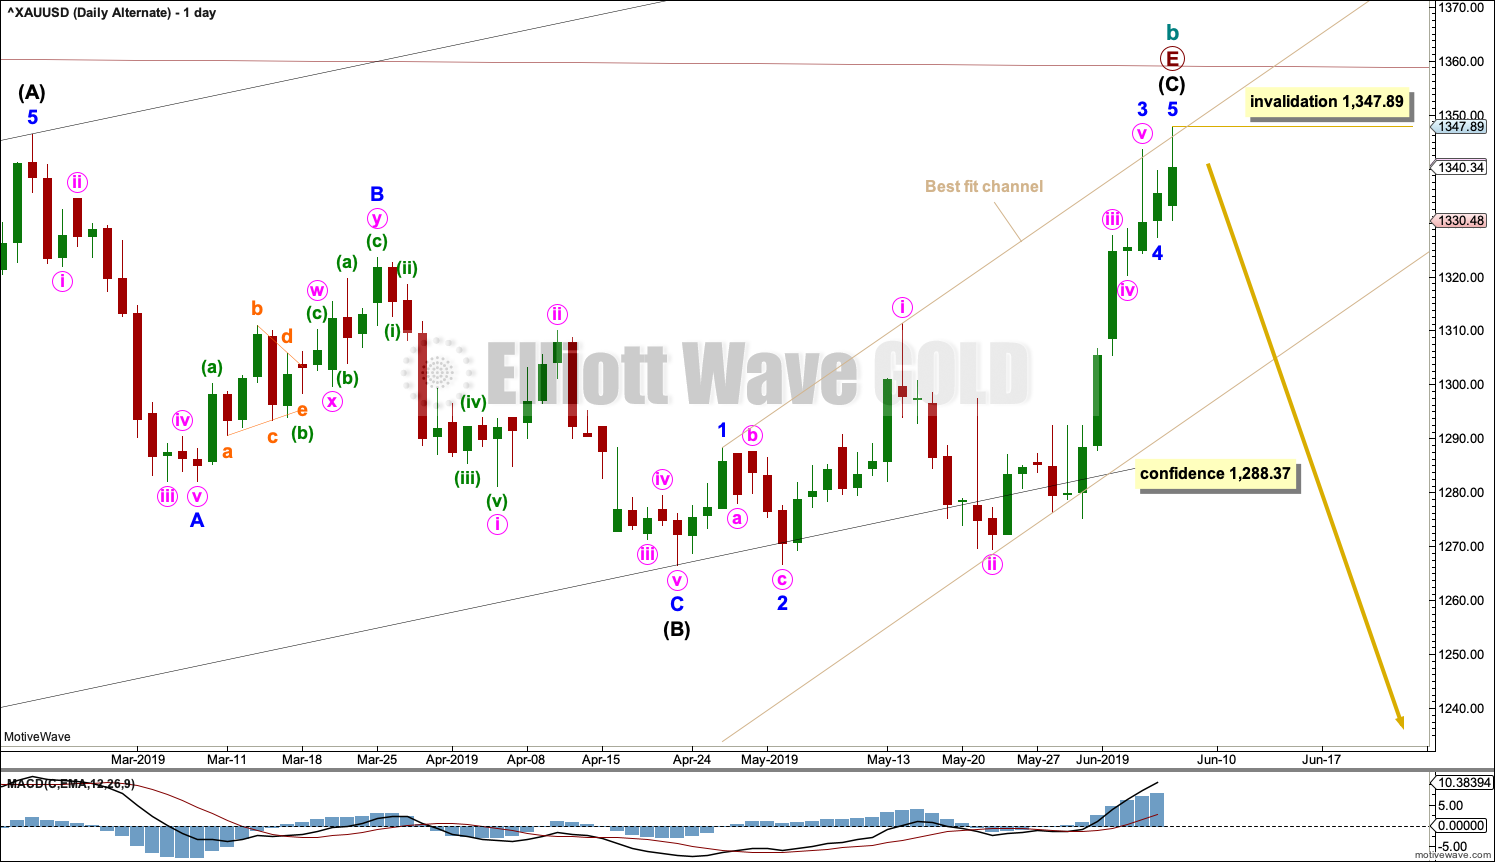
Click chart to enlarge.
It is also possible that intermediate wave (C) may be complete in its entirety. Minor wave 4 may have been very brief as was minute wave iv. This follows a common pattern for Gold.
Reasonable confidence that a high is in place would come with a breach of the taupe best fit channel. Thereafter, strong confidence would come with a breach of the black Elliott channel.
WEEKLY CHART – DOUBLE ZIGZAG
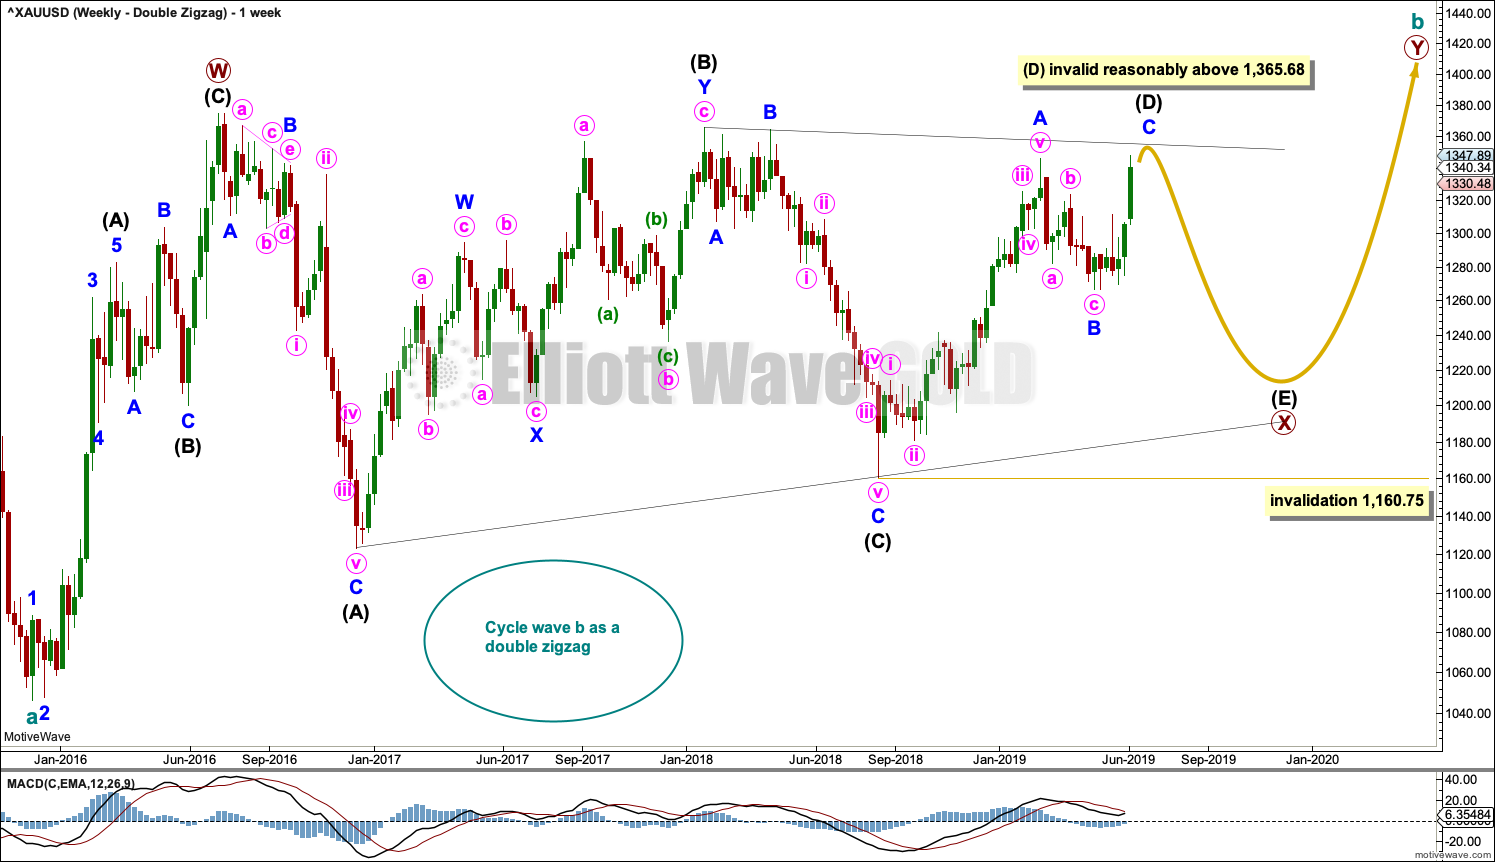
Click chart to enlarge.
This wave count is identical to the first weekly chart up to the low labelled cycle wave a. Thereafter, a different Elliott wave corrective structure is considered for cycle wave b.
It is possible that cycle wave b may be an incomplete double zigzag or a double combination.
The first zigzag in the double is labelled primary wave W. This has a good fit.
The double may be joined by a corrective structure in the opposite direction, a triangle labelled primary wave X. The triangle may be incomplete.
Within multiples, X waves are almost always zigzags and rarely triangles. Within the possible triangle of primary wave X, it is intermediate wave (B) that is a multiple; this is acceptable, but note this is not the most common triangle sub-wave to subdivide as a multiple. These two points reduce the probability of this wave count in terms of Elliott wave.
Intermediate wave (D) of a contracting triangle may not move beyond the end of intermediate wave (B) above 1,365.68.
Intermediate wave (D) of a barrier triangle may end about the same level as intermediate wave (B); as long as the (B)-(D) trend line remains essentially flat the triangle will remain valid. This is the only Elliott wave rule that is not black and white. In practice, intermediate wave (D) may end slightly above intermediate wave (B) at 1,365.68 and this wave count would remain valid. The (B)-(D) trend line is carefully laid to sit across the end of intermediate wave (B) and minor wave B within intermediate wave (C). This may show exactly where intermediate wave (D) ends if this wave count is correct. This wave count would expect just a little more upwards movement next week so that the (B)-(D) trend line sits as shown with no to little overshoots.
Primary wave Y would most likely be a zigzag because primary wave X would be shallow; double zigzags normally have relatively shallow X waves.
Primary wave Y may also be a flat correction if cycle wave b is a double combination, but combinations normally have deep X waves. This would be less likely.
This wave count has good proportions and no problems in terms of subdivisions.
ALTERNATE ELLIOTT WAVE COUNT
WEEKLY CHART
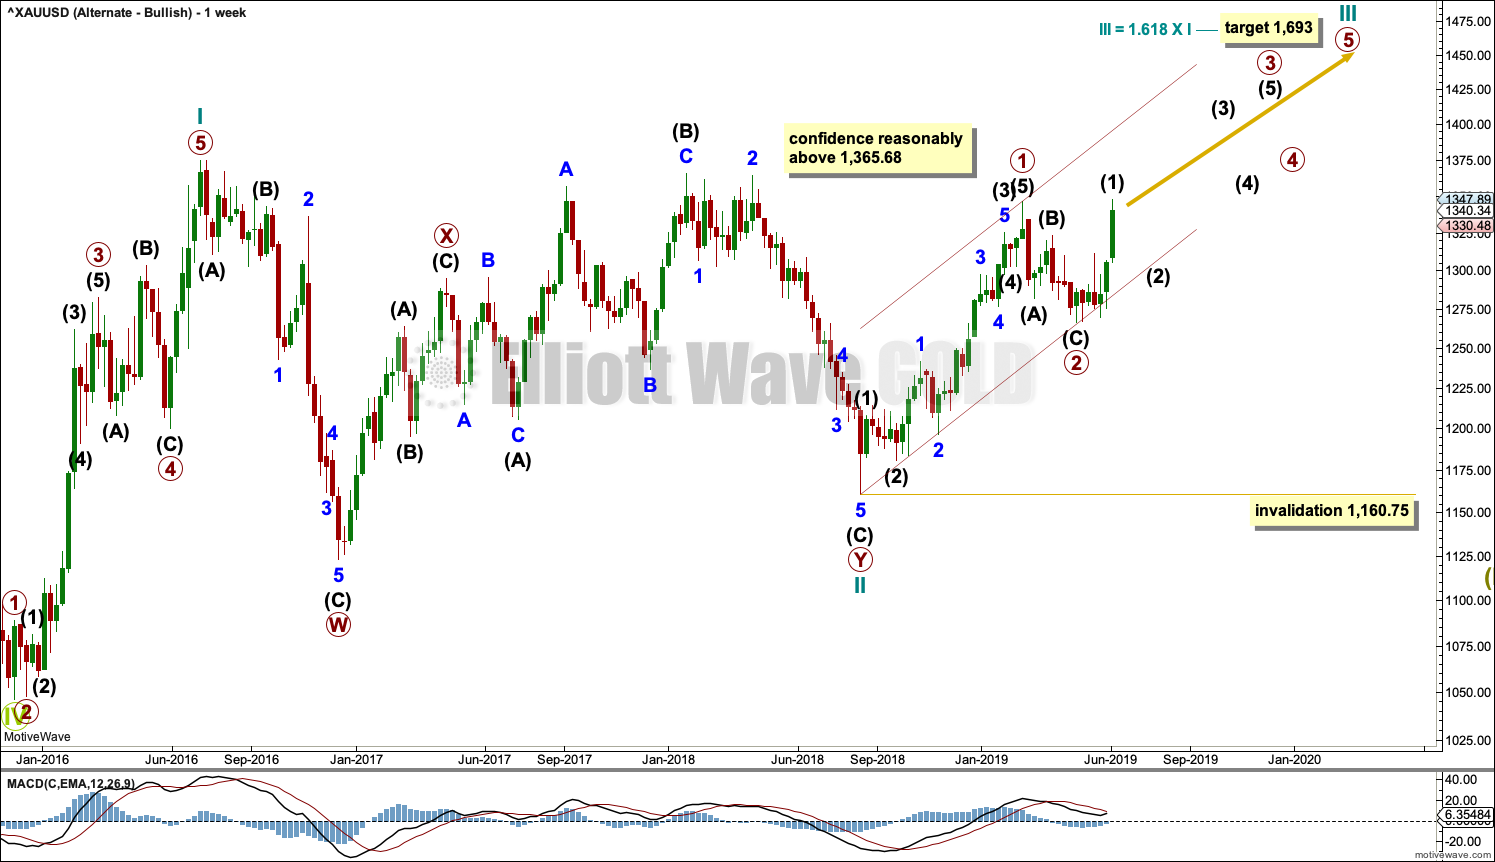
Click chart to enlarge.
This wave count sees the three waves back now complete at the last major low for Gold in November 2019.
If Gold is in a new bull market, then it should begin with a five wave structure upwards on the weekly chart. However, the biggest problem with this wave count is the structure labelled cycle wave I because this wave count must see it as a five wave structure, but it looks more like a three wave structure.
Commodities often exhibit swift strong fifth waves that force the fourth wave corrections coming just prior and just after to be more brief and shallow than their counterpart second waves. It is unusual for a commodity to exhibit a quick second wave and a more time consuming fourth wave, and this is how cycle wave I is labelled. The probability of this wave count is low due to this problem.
Cycle wave II subdivides well as a double combination: zigzag – X – expanded flat.
Cycle wave III may have begun. Within cycle wave III, primary waves 1 and 2 may now be complete. If it continues lower as a double zigzag, then primary wave 2 may not move beyond the start of primary wave 1 below 1,160.75.
Cycle wave III so far for this wave count would have been underway now for 43 weeks. This week it may be beginning to exhibit some support from volume and increasing ATR. If this increase continues, then this wave count would have some support from technical analysis.
TECHNICAL ANALYSIS
WEEKLY CHART
Click chart to enlarge. Chart courtesy of StockCharts.com.
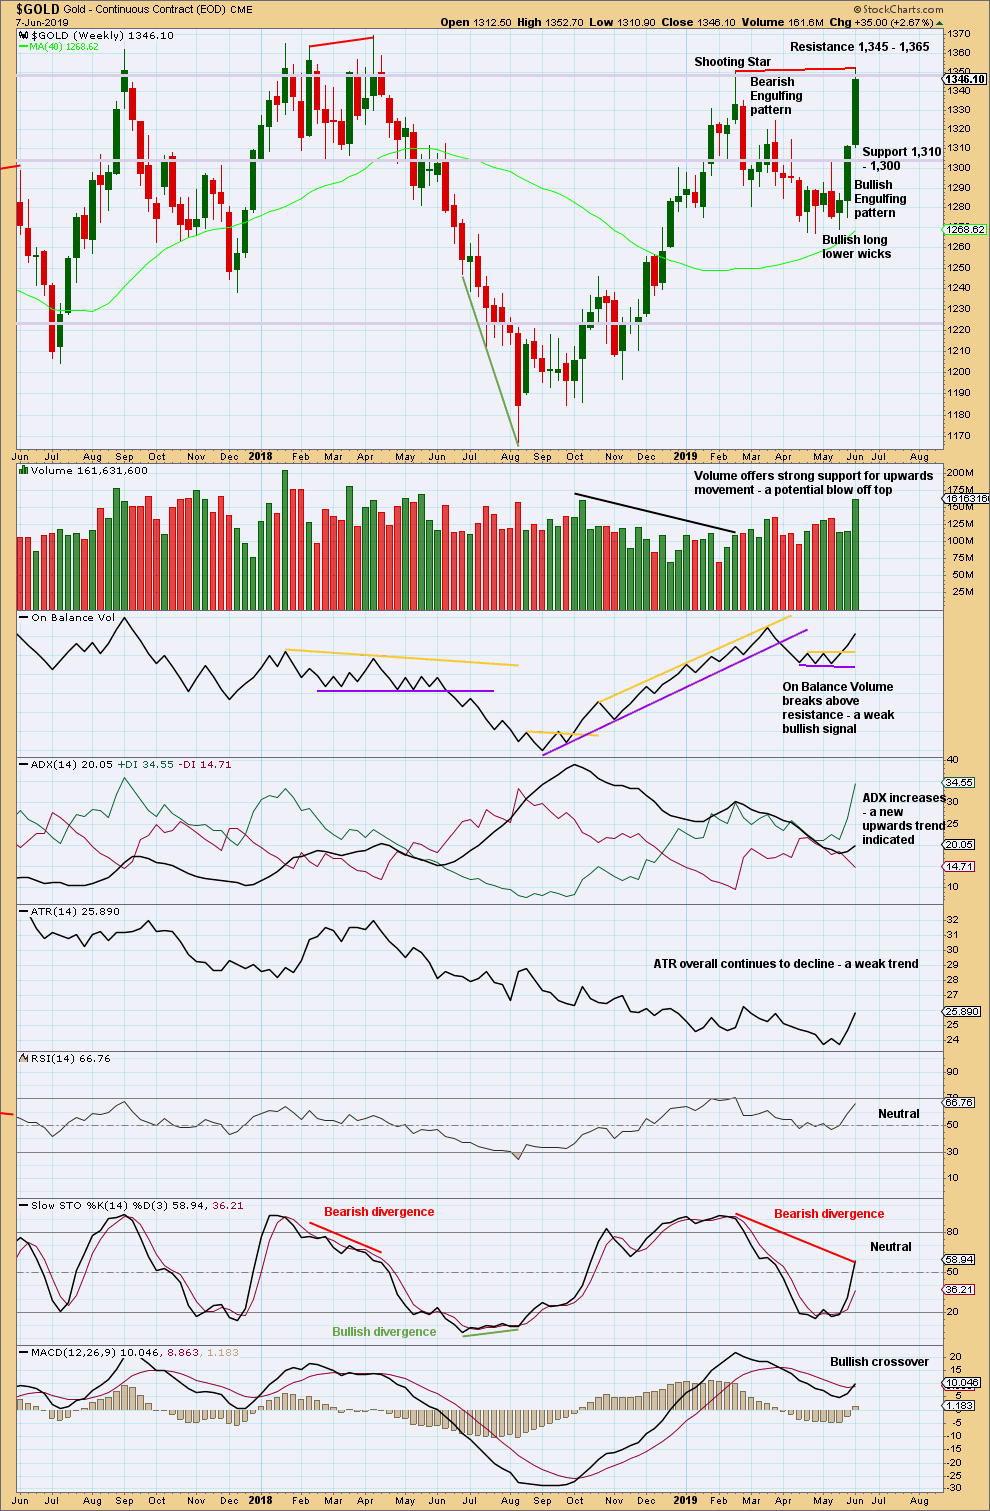
At the last few major highs for Gold (on weeks of 5th July 2016, 5th September 2017, 9th April 2018 and 19th February 2019) the following points are noted:
– Volume was not the strongest for the last upwards week. Some decline in volume accompanied the final high.
– Bearish divergence was seen between price and Stochastics in only two of four of the identified major highs.
– Bearish divergence was seen between price and RSI in only one of four of the identified major highs.
Currently, there is very strong bearish divergence between price and Stochastics: This week price has made a slight new high, but Stochastics is reasonably lower than it was at the last swing high.
Volume however shows no decline this week. It shows a strong increase. This is rarely seen right at a final high, so some further upwards movement may be reasonably expected. This favours the main Elliott wave count.
DAILY CHART
Click chart to enlarge. Chart courtesy of StockCharts.com.
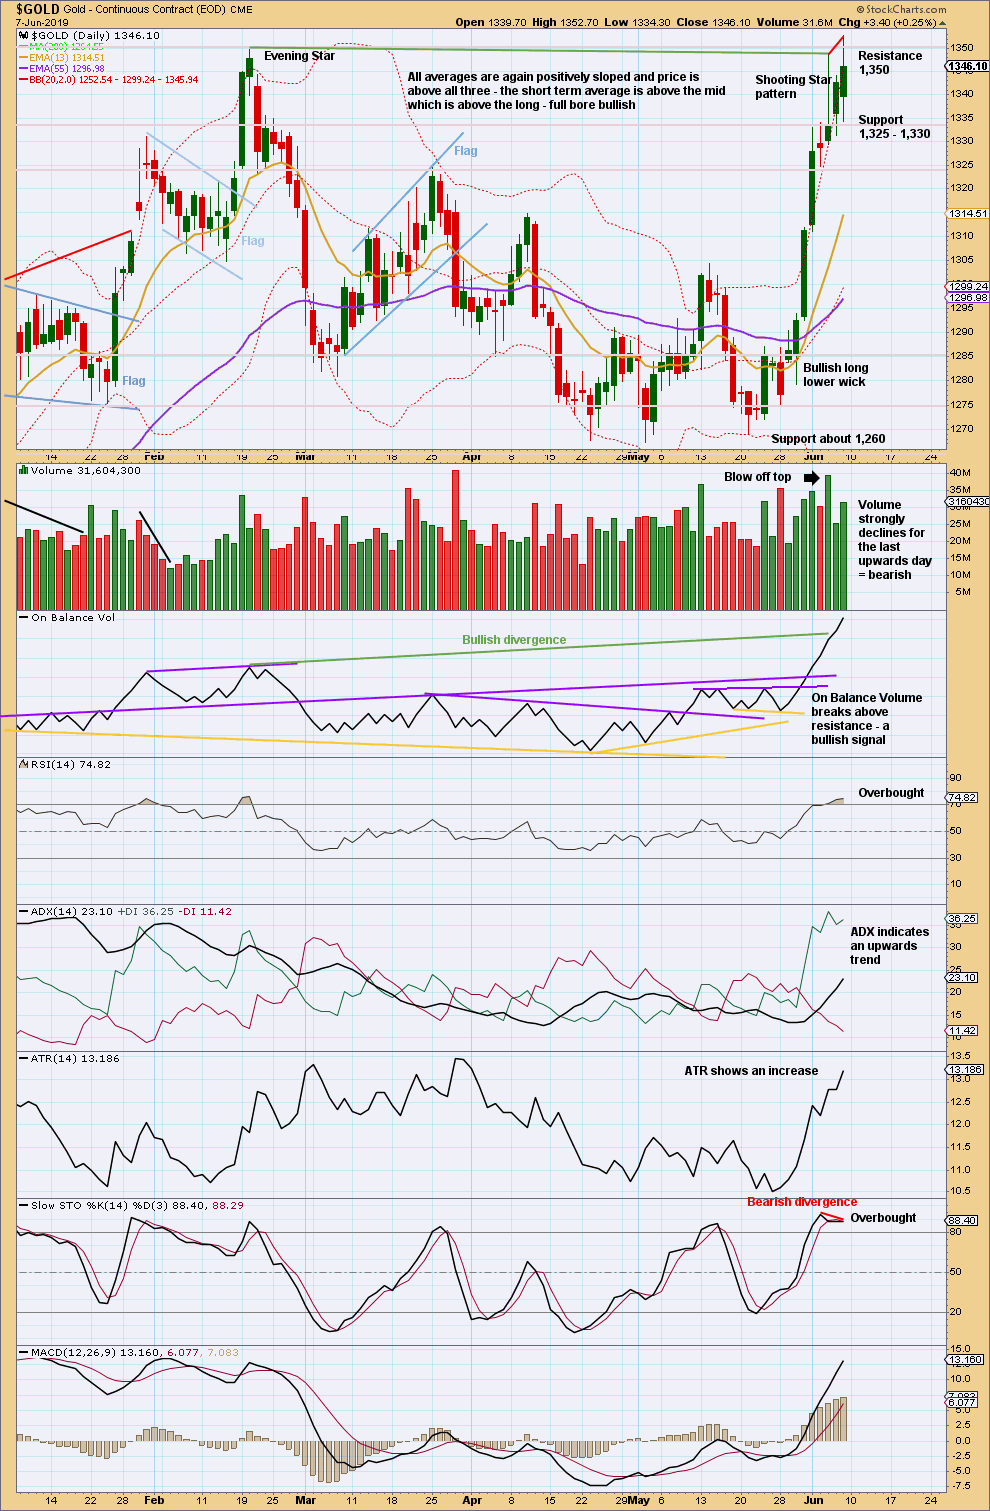
At the daily chart level, there is some decline in volume at the last high for Friday. With both RSI and Stochastics extreme and some bearish divergence between price and Stochastics, some consolidation to relieve extreme conditions would be normal to see after the blow off top. Thereafter, price may continue higher.
The trend is currently upwards. Assume the trend remains the same until proven otherwise. At this stage, there is no evidence that the trend is over.
GDX WEEKLY CHART
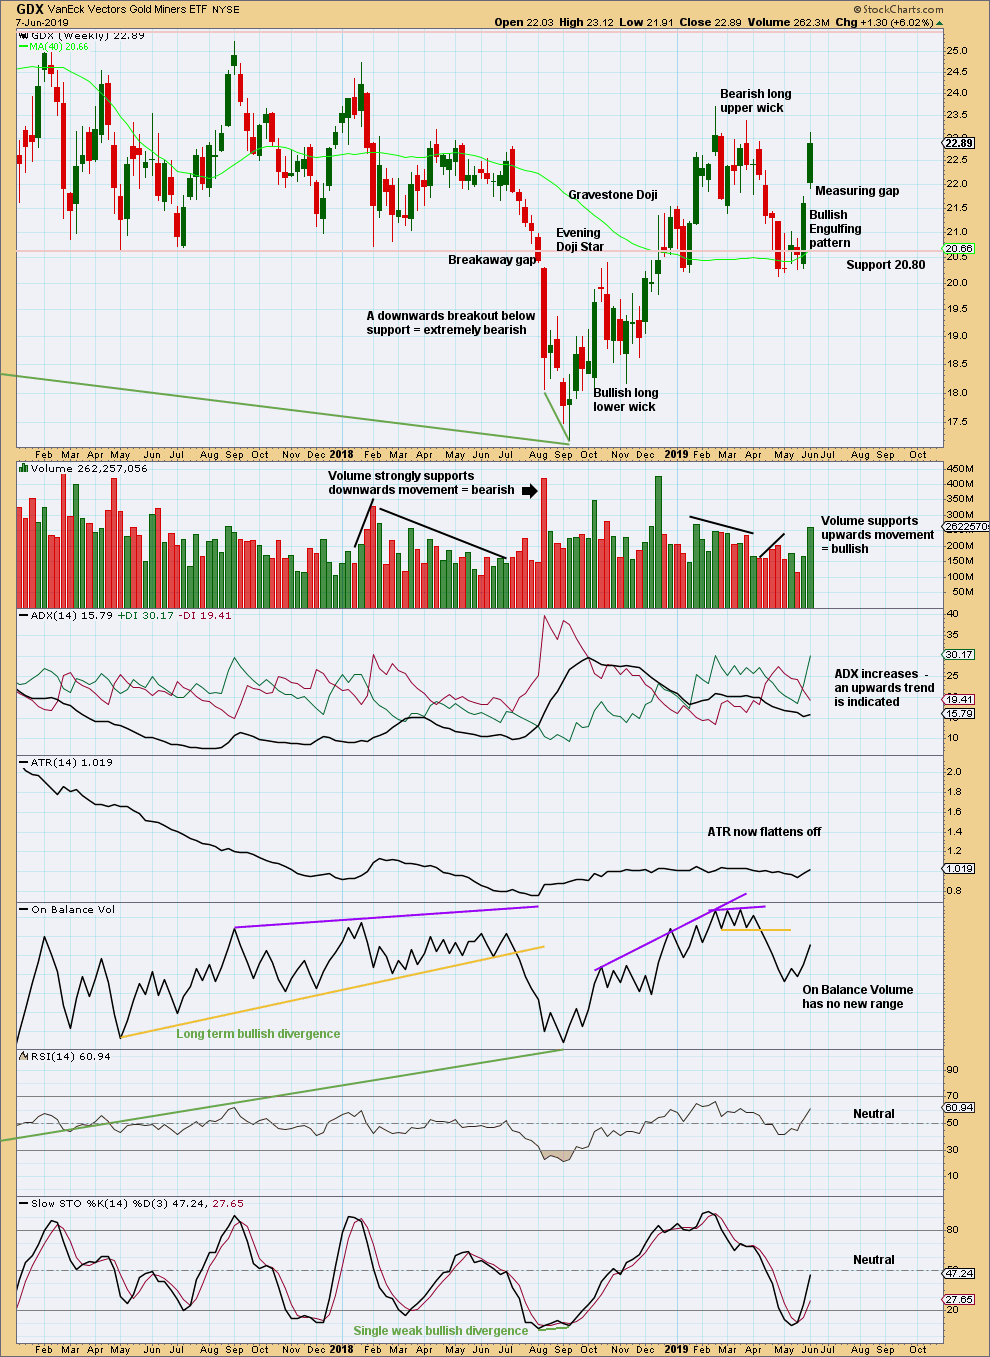
Click chart to enlarge. Chart courtesy of StockCharts.com.
The measuring gap gives a target at 23.39. However, this has already been almost met.
GDX DAILY CHART
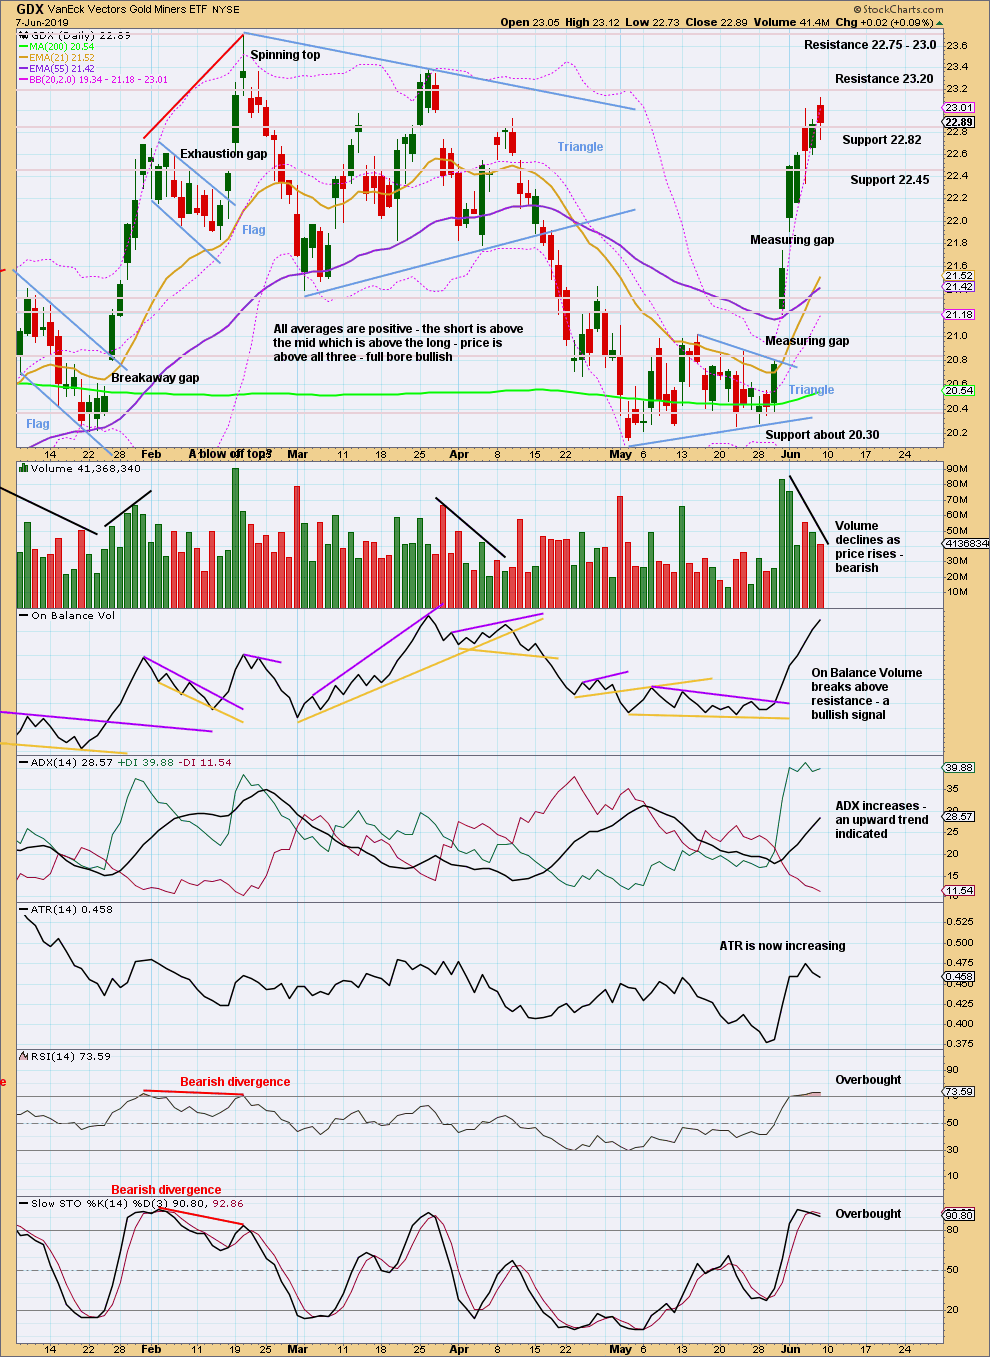
Click chart to enlarge. Chart courtesy of StockCharts.com.
The last measuring gap may now provide support. It may remain open at 21.74.
With both Stochastics and RSI extreme and volume declining, this upwards trend is showing enough weakness at this time for extreme caution to be warranted.
US OIL
Downwards movement was expected to continue for the week, which is exactly what has happened.
The Elliott wave structure is used to indicate when and where bounces may occur. Candlestick patterns and volume are used to guide the Elliott wave count.
Summary: A relatively shallow bounce for a fourth wave may continue next week. It may be a time consuming sideways consolidation that may find resistance about the upper edge of the Elliott channel. It may last a total of about two weeks. The target is 55.65. The bounce should not move above 60.04.
If price does come up to touch the upper edge of the channel, that may be used as an entry opportunity to join the downwards trend.
When this bounce or consolidation is complete, then a target may be calculated for the fifth wave down to end. That cannot be done yet.
The final target is now calculated at 10.72.
MAIN ELLIOTT WAVE COUNT
MONTHLY CHART
Click chart to enlarge.
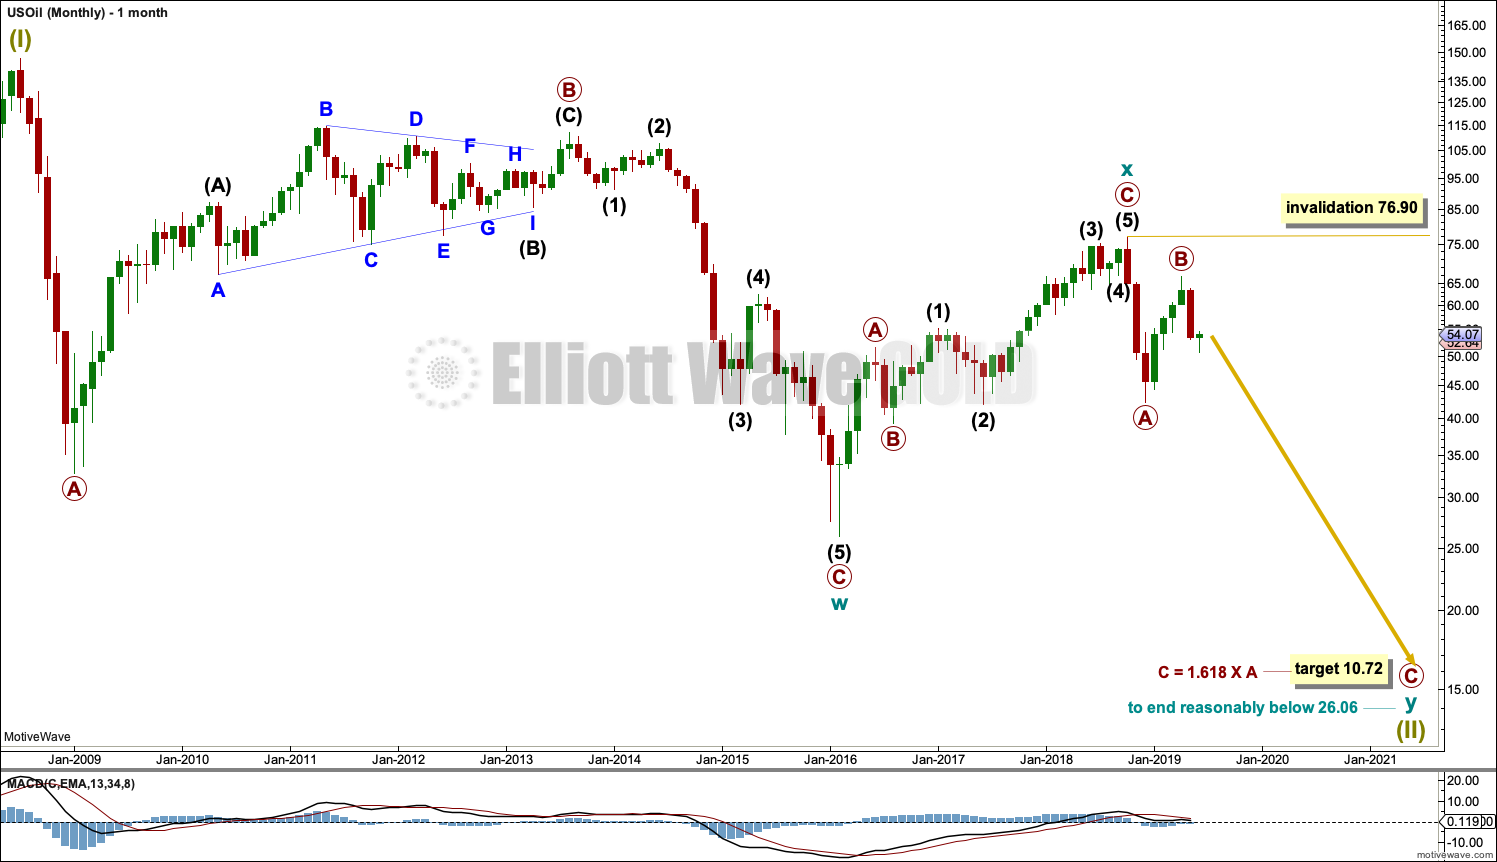
The basic Elliott wave structure is five steps forward and three steps back. This Elliott wave count expects that US Oil is still within a three steps back pattern, which began in July 2008. The Elliott wave count expects that the bear market for US Oil continues.
This Elliott wave corrective structure is a double zigzag, which is a fairly common structure. The correction is labelled Super Cycle wave (II).
The first zigzag in the double is complete and labelled cycle wave y. The double is joined by a three in the opposite direction labelled cycle wave x, which subdivides as a zigzag. The second zigzag in the double may now have begun, labelled cycle wave w.
The purpose of a second zigzag in a double zigzag is to deepen the correction when the first zigzag does not move price deep enough. To achieve this purpose cycle wave y may be expected to move reasonably below the end of cycle wave w at 26.06. The target calculated would see this expectation met.
Cycle wave y is expected to subdivide as a zigzag, which subdivides 5-3-5.
Cycle wave w lasted 7.6 years and cycle wave x lasted 2.7 years. Cycle wave y may be expected to last possibly about a Fibonacci 5 or 8 years.
If it continues higher, then primary wave B may not move beyond the start of primary wave A above 76.90.
WEEKLY CHART
Click chart to enlarge.
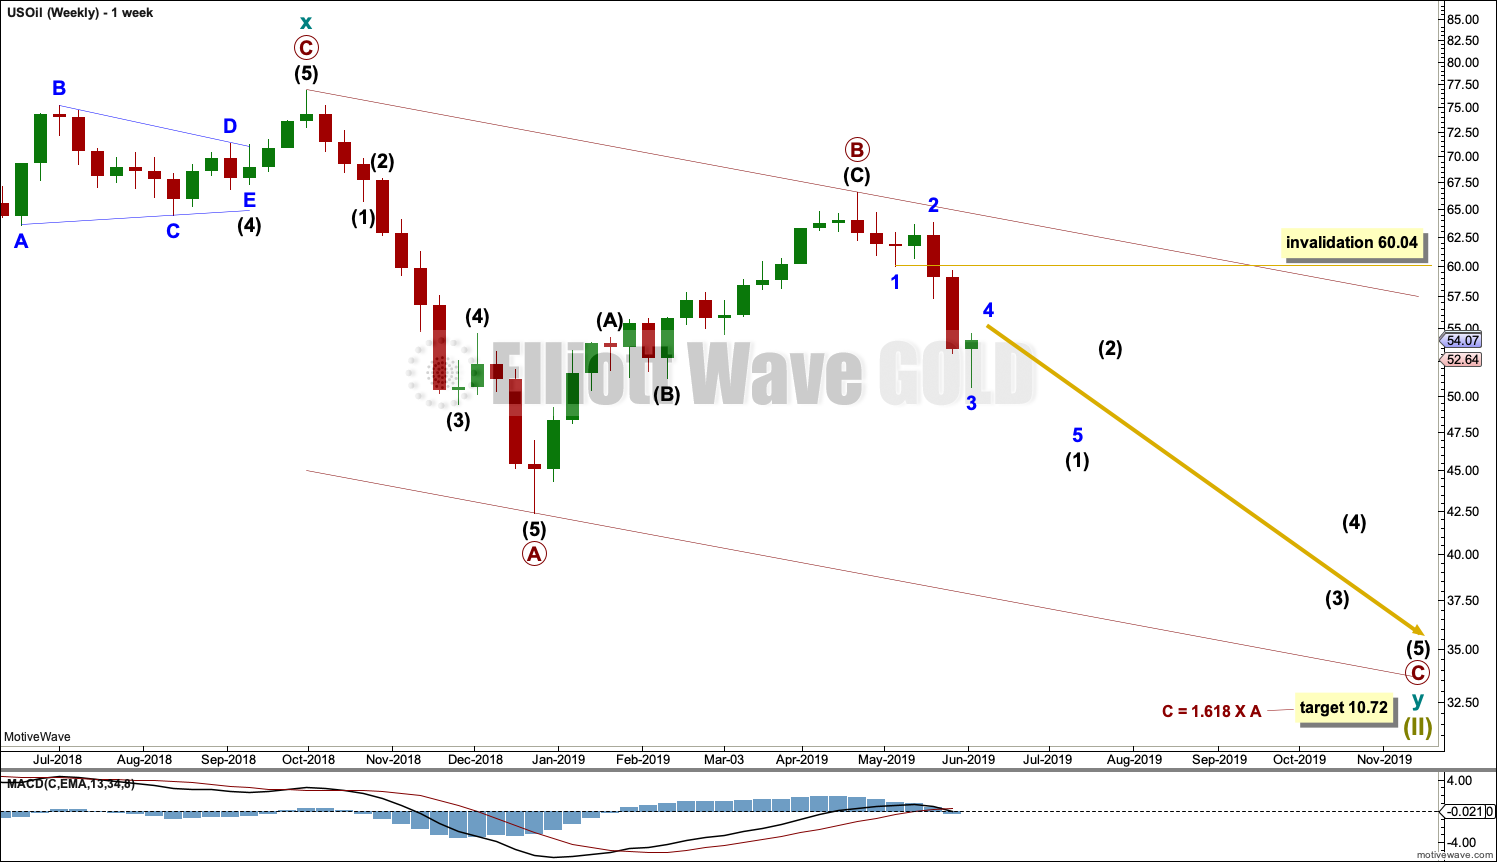
This weekly chart is focussed on the start of cycle wave y.
Cycle wave y is expected to subdivide as a zigzag. A zigzag subdivides 5-3-5. Primary wave A must subdivide as a five wave structure if this wave count is correct.
Primary wave A may be a complete five wave impulse at the last low.
Primary wave B may now be a complete single zigzag at the last high.
Primary wave C may have just begun. Primary wave C must subdivide as a five wave structure.
Primary wave A lasted 12 weeks, just one short of a Fibonacci 13.
Primary wave C may be longer in time as well as price. If cycle wave y lasts a Fibonacci 5 years, then primary wave C within it may take as long as a Fibonacci 233 weeks.
Intermediate wave (1) within primary wave C may be subdividing as an impulse. Within the impulse, minor wave 4 may not move into minor wave 1 price territory above 60.04.
Draw a channel about the zigzag of primary wave y using Elliott’s technique for a correction. Draw the first trend line from the start of primary wave A to the end of primary wave B, then place a parallel copy on the end of primary wave A. The upper edge of this channel may show where bounces along the way down find resistance. The lower edge of the channel may provide support.
When intermediate wave (1) is complete, then a bounce for intermediate wave (2) may be a multi-week bounce that may find resistance at the upper edge of the Elliott channel.
DAILY CHART
Click chart to enlarge.
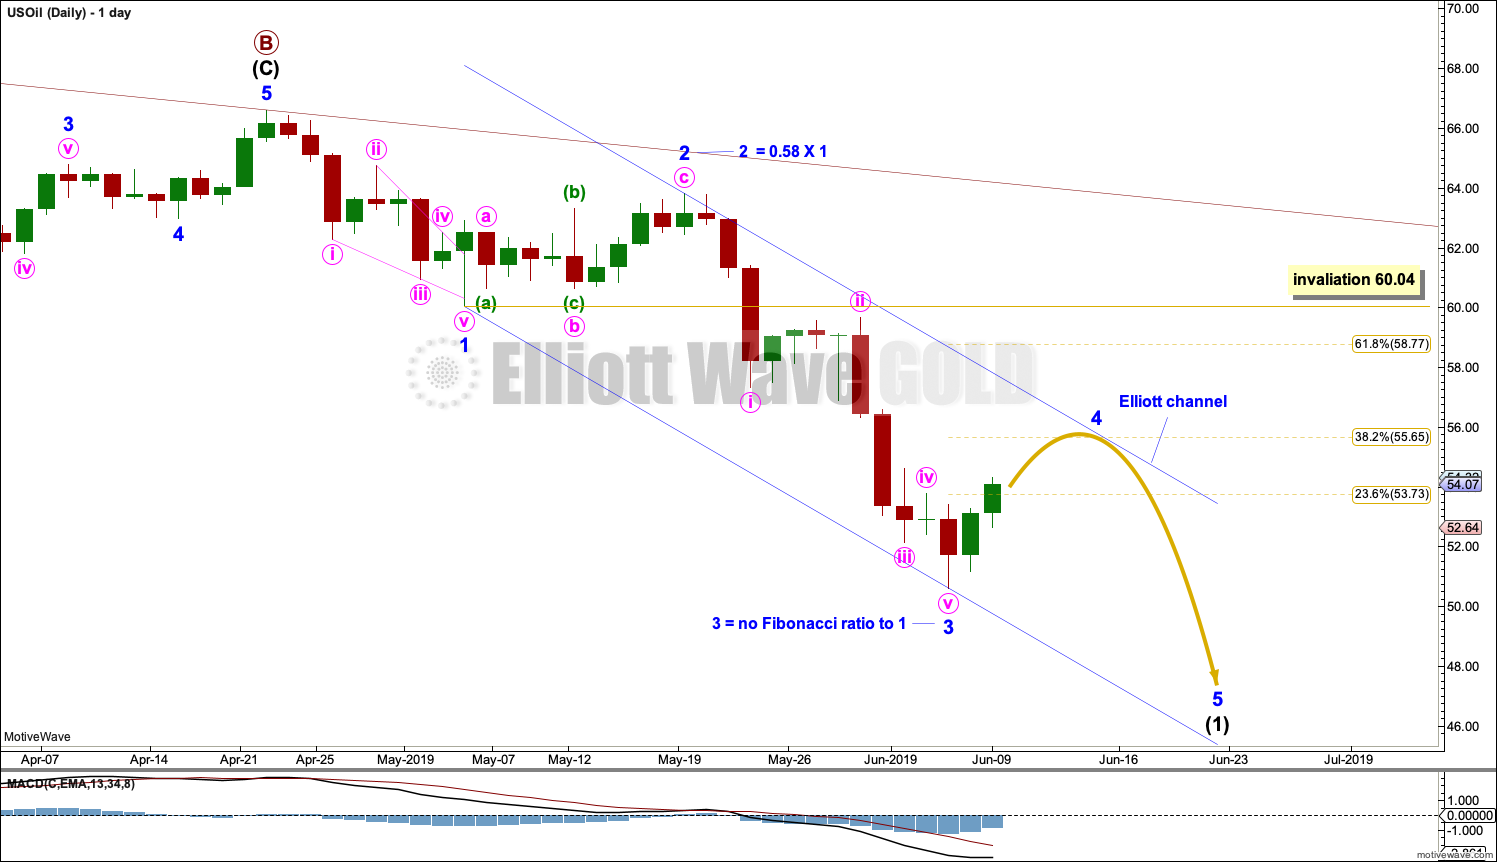
Note that monthly and weekly charts are on a semi-log scale, but this daily chart is on an arithmetic scale. This makes a slight difference to trend channels.
The daily chart this week focusses on the structure of intermediate wave (1) within primary wave C.
Intermediate wave (1) may be unfolding as an impulse. Within intermediate wave (1), minor waves 1 through to 3 may now be complete. Minor wave 3 shows an increase in downwards momentum beyond that of minor wave 1. This wave count fits with MACD.
Minor wave 2 was a relatively deep zigzag lasting 10 sessions. Minor wave 4 may exhibit alternation as a shallow flat, combination or triangle. The preferred target would be the 0.382 Fibonacci ratio of minor wave 3. Minor wave 4 may last about two weeks, or it may be longer lasting as sideways corrections do tend to be longer lasting than zigzags.
Minor wave 4 may find resistance about the upper edge of the blue Elliott channel. Draw this channel with the first trend line from the ends of minor waves 1 to 3, then place a parallel copy on the end of minor wave 2.
Minor wave 3 did not exhibit a Fibonacci ratio to minor wave 1. Minor wave 5 would be likely to exhibit a Fibonacci ratio to either of minor waves 1 or 3, with equality in length with minor wave 1 at $6.55 the most likely. When minor wave 4 is complete and the start of minor wave 5 is know, then the Fibonacci ratio may be applied to calculate a target for minor wave 5 to end. That cannot be done yet.
TECHNICAL ANALYSIS
MONTHLY CHART
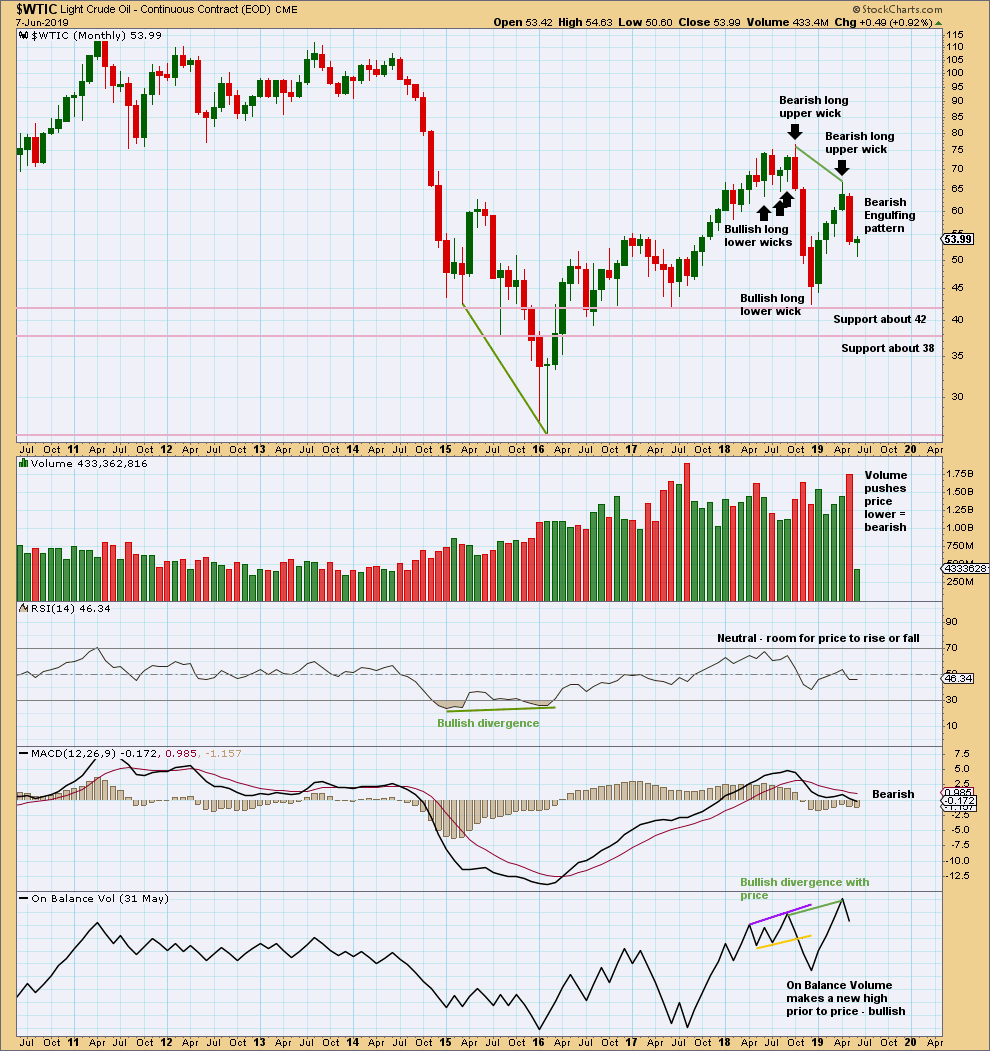
Click chart to enlarge. Chart courtesy of StockCharts.com.
May has closed with a strong Bearish Engulfing candlestick pattern, which has strong support from volume. This supports the Elliott wave count.
WEEKLY CHART
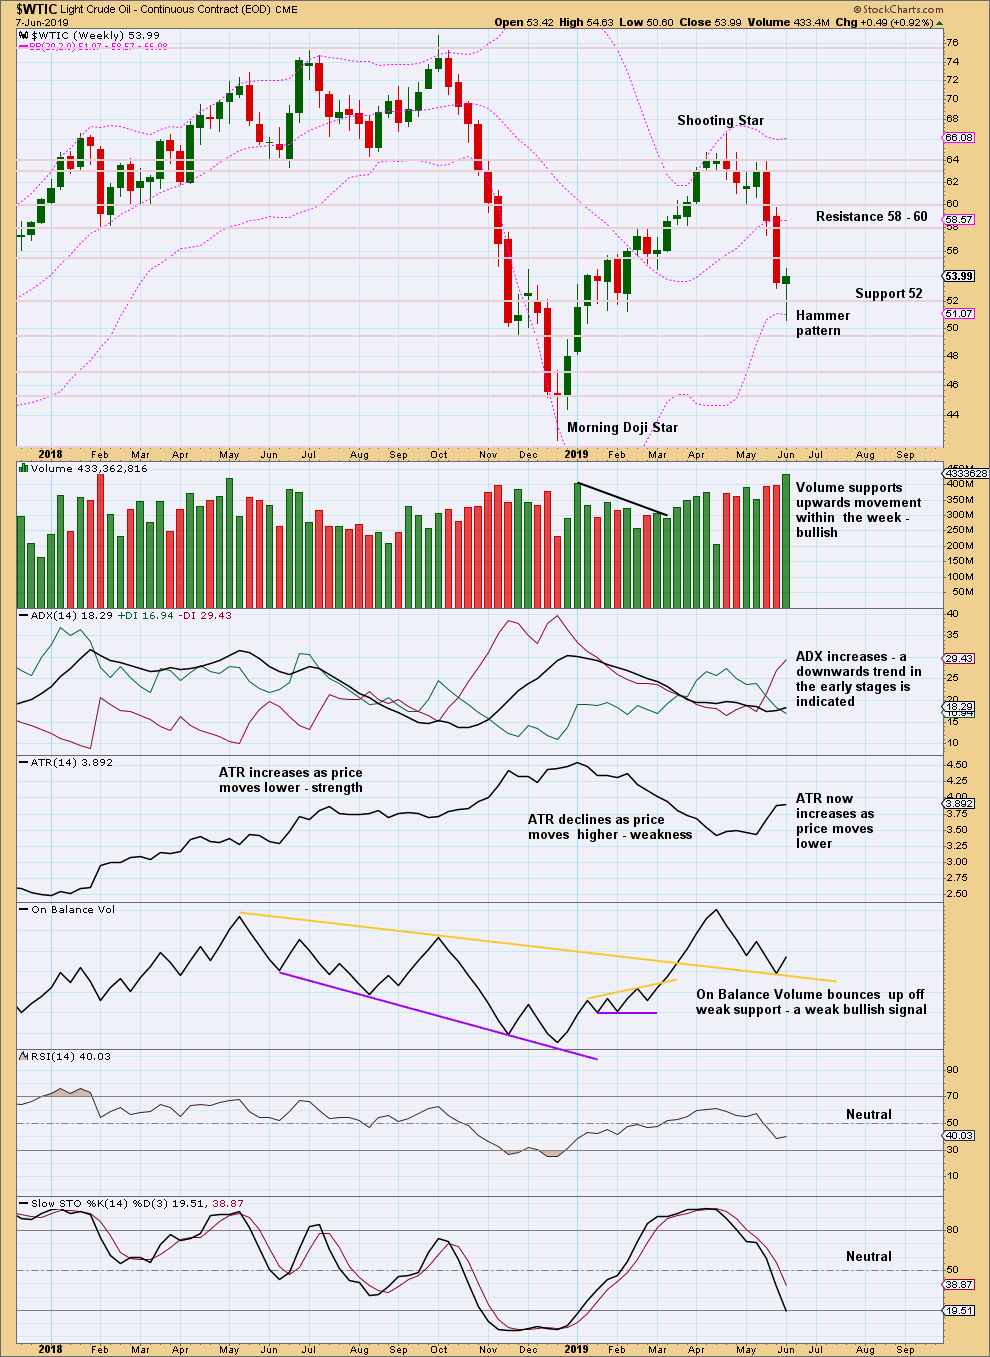
Click chart to enlarge. Chart courtesy of StockCharts.com.
This week the bullish candlestick pattern, bullish short-term volume, and a bullish signal from On Balance Volume all support the short-term expectation for the Elliott wave count for a bounce or consolidation to continue here.
DAILY CHART
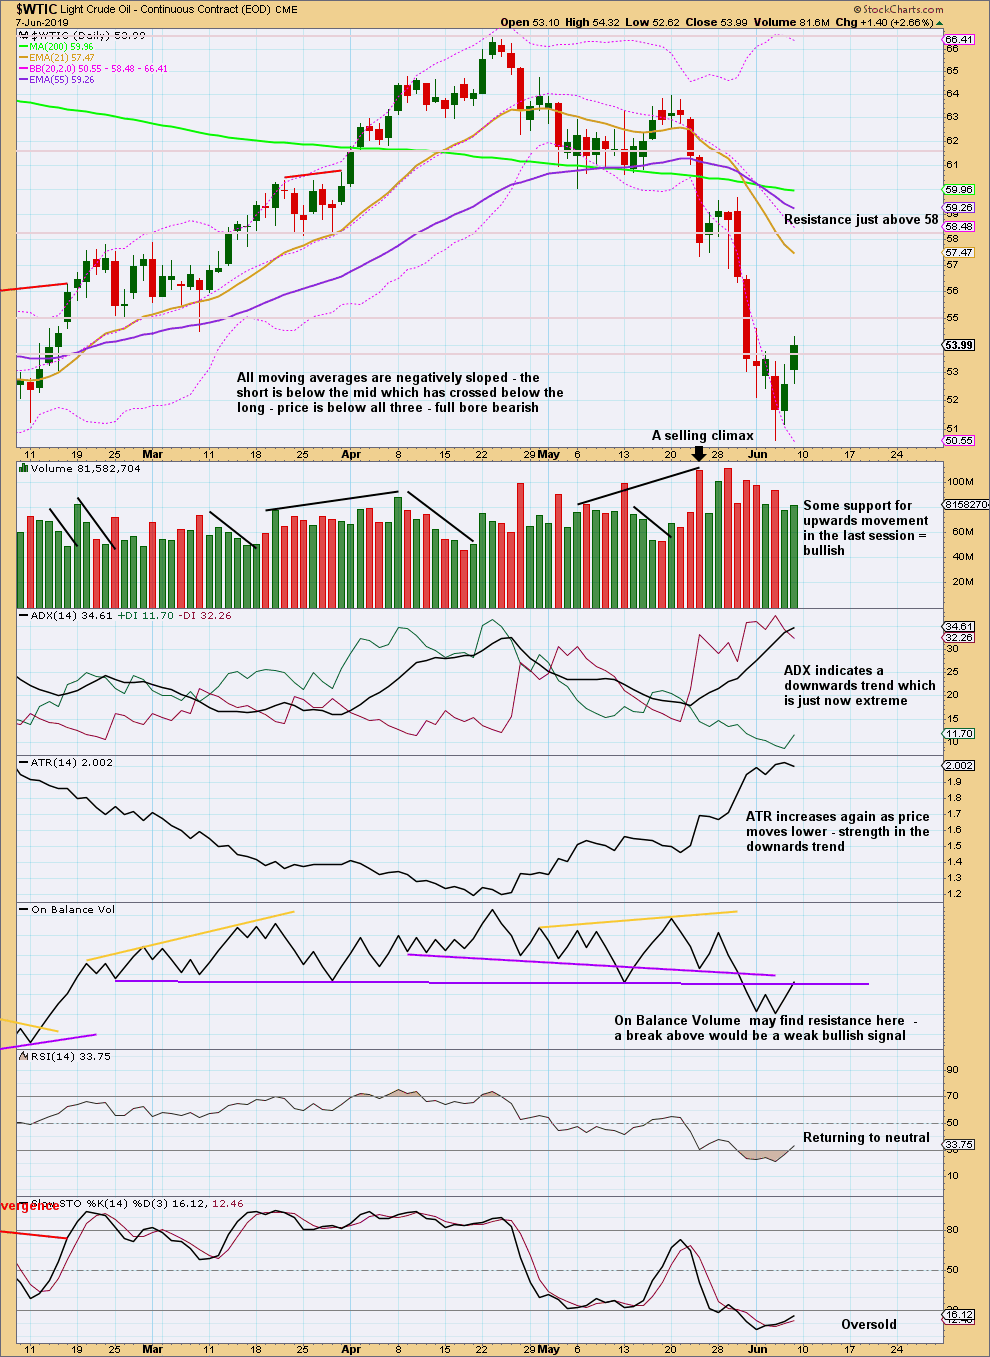
Click chart to enlarge. Chart courtesy of StockCharts.com.
Some consolidation or a bounce may unfold here to relieve extreme conditions for the short term. For the short term, some support from volume for the last upwards session indicates more upwards movement next week. This should be assumed to be a counter trend movement.
—
Always practice good risk management as the most important aspect of trading. Always trade with stops and invest only 1-5% of equity on any one trade. Failure to manage risk is the most common mistake new traders make.
I’ve extended my short positions on today’s $20 reversal in the POG. Pretty incredible top call by Lara if this C wave down plays out!
Well, to be fair, there was some uncertainty with my alternate and main counts flip flopping a couple of times in the last week or two. And running them side by side… and not being really confident which is the correct one.
There does usually seem to be some uncertainty at possible trend changes.
However, today Gold is looking much more like there is a high in place. That’s a nice reversal and another nice Shooting Star. The TA is going to quite strongly support the main EW count today. Which I’ll be doing next, and I’m quite excited about
Hi Lara. EWF opened their pro oil services to the public for a few days. Their count is similar to yours but their main count appears a little earlier in the sub waves. Do you have any thoughts?
Also I have noticed they use sentiment readings in their analysis, have you considered using this information?
Best regards
Baron
That’s another way to count this move down which is also valid. I’m going to stick with the way I’m counting it though, it fits so well with MACD. I’ll keep the other way in mind, but if I go with that and its wrong we would miss intermediate (2) up.
Regarding sentiment: I could get it for futures, but I’m analysing the cash market. Not sure I want to start mixing it up, using an indicator for one and basing my EW count on the other. Also, sure it can be helpful, but it can also show some divergence yet price can continue in the same trend (in other words, it can be read as a false signal of a trend change).
I used to use Oil $OVX on a daily chart with my Oil analysis as an indicator of volatility, to assist in identifying potential highs and lows. After some time (years?) I decided to stop doing that as it just did not seem to be an assistance.
Hi Lara,
I missed your post regarding USD index, made in the comments section of the June 1st analysis. You said “It wasn’t easy, and had me a bit stumped for just a couple of hours. That rarely happens.”
When you post it this weekend, could you kindly point where/what had you stumped and what was your thought process in resolving it and the EW rules/guidelines involved, please? It would be most valuable for those of us learning EW analysis from you, please.
Thank you kindly.
Sure. I’ll do so in comments under the USD Index post.
Thank you much.
Hi Lara,
Hope you’re well. I sent you some data on the toronto housing market around the time you went to Texas. Did you get a chance to look at it?
Thanks in advance,
I’m so sorry, I’ve forgotten about that with the trip to Texas.
I will take a look at it now.
Have looked at it today and emailed you.
Hi Lara,
Wow, merger Monday and it is causing havoc in the markets…. Gold down big and Nasdaq up big…. AD line (intraday) is at a new high…
Now, the DATA-CRM deal is causing all the cloud stocks to rally to new highs….
A bubble in the making like 1999????
I am now on the fence on which of your scenarios is going to materialize… Very hard to tell…
This is very interesting… Where is the popcorn? 🙂
Mathieu
Lara’s Gold count called for a leg down, before the final blow off top, and for the SPX to make 3000+ …
Many are saying that we’re in an upward triangle, which means we’re going to explode to the upside … I hope Lara is right … nice long short down for a while would suit me.
An upwards triangle… I’ve seen some musing that there is some kind of triangle which when complete would be followed by an upwards breakout. But EW triangles are continuation patterns coming before the final move. So the double ZZ count fits that idea.
EW triangles can only be in waves B, 4, X, W or Z positions. In this instance at the weekly chart time frame it simply cannot be a fourth wave, nor Z wave. It could be forced to be in a Y position (horrible count, and expecting a downwards breakout), could be forced to be a B wave. But after wave C or Y, then the bear market would be expected to resume for such a count.
In short, seeing any kind of triangle here on the weekly chart for Gold is overall a bearish count.
So the musing of an upwards breakout, makes no sense to me. I’ve yet to see an actual labelled count for the idea, which meets all EW rules.
That’s what I wanted to hear – LOL
(S&P 500) Made a good return from the bottom…. The high growth stocks are correcting today… I went into cash…
Maybe we are hitting a short term top?
Mathieu
Went back into high growth stock this morning… They are still motoring. I would say this pull back is short lived…
That’s what I’m expecting. Brief and shallow. The pull now of intermediate (3) within primary wave 3 may make it so.
Hi Lara,
With my analysis that I just did, I am noticing that some gold stocks are starting to break out… Aside from KL (US), GFI (US) and AU (US) are breaking out…
I am also noticing that the Canadian Dollar is showing some strength lately and maybe a new uptrend.
I am also noticing that the Canadian equities are outperforming the US equities…
I noticed that the steepness of the AD line is slowing compared to the S&P 500 price.
All these above indicators are more signs that your S&P 500 main EW count might be the correct one. So maybe a top in October is possible…
Very interesting…
All the best to you,
Mathieu