

S&P 500
Downwards movement at the end of Friday’s session remains above the short-term invalidation point and within the short-term best fit channel. However, at the end of the week a pattern on the weekly chart along with the AD line and inverted VIX suggest a new Elliott wave count.
Summary: A new Elliott wave count on the daily chart expects a deeper more time consuming correction which may reach to 2,939 or below. This has support from some bearish divergence between price and all of the AD line, VIX and On Balance Volume, and a Bearish Engulfing candlestick pattern on the weekly chart.
A bullish Elliott wave count remains valid while price remains above 2,963.44. For this count, a short-term target for the middle of a third wave to end is now at 3,097. A mid-term target for a third wave at intermediate degree is at 3,148.
The biggest picture, Grand Super Cycle analysis, is here.
Monthly charts were last published here, with video here. There are two further alternate monthly charts here. Video is here.
ELLIOTT WAVE COUNTS
The two weekly Elliott wave counts below will be labelled First and Second. They may be about of even probability. When the fifth wave currently unfolding on weekly charts may be complete, then these two wave counts will diverge on the severity of the expected following bear market. To see an illustration of this future divergence monthly charts should be viewed.
FIRST WAVE COUNT
WEEKLY CHART
Click chart to enlarge.
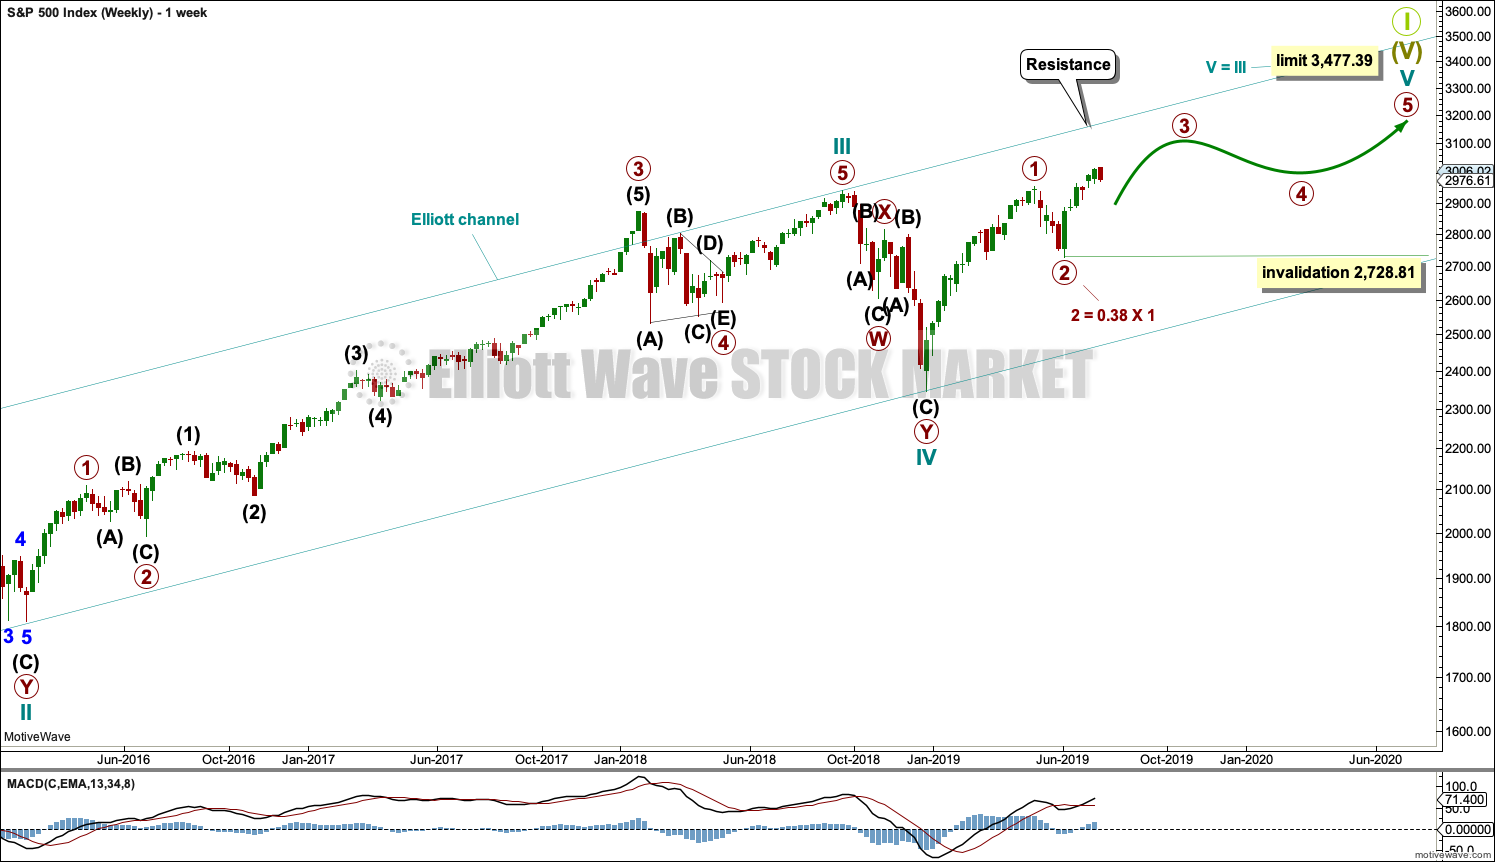
The basic Elliott wave structure consists of a five wave structure up followed by a three wave structure down (for a bull market). This wave count sees the bull market beginning in March 2009 as an incomplete five wave impulse and now within the last fifth wave, which is labelled cycle wave V. This impulse is best viewed on monthly charts. The weekly chart focusses on the end of it.
Elliott wave is fractal. This fifth wave labelled cycle wave V may end a larger fifth wave labelled Super Cycle wave (V), which may end a larger first wave labelled Grand Super Cycle wave I.
The teal Elliott channel is drawn using Elliott’s first technique about the impulse of Super Cycle wave (V). Draw the first trend line from the end of cycle wave I (off to the left of the chart, the weekly candlestick beginning 30th November 2014) to the end of cycle wave III, then place a parallel copy on the end of cycle wave II. This channel perfectly shows where cycle wave IV ended at support. The strongest portion of cycle wave III, the end of primary wave 3, overshoots the upper edge of the channel. This is a typical look for a third wave and suggests the channel is drawn correctly and the way the impulse is counted is correct.
Within Super Cycle wave (V), cycle wave III is shorter than cycle wave I. A core Elliott wave rule states that a third wave may never be the shortest. For this rule to be met in this instance, cycle wave V may not be longer in length than cycle wave III. This limit is at 3,477.39.
Within cycle wave V, primary waves 1 and 2 may now be complete. Within primary wave 3, no second wave correction may move beyond its start below 2,728.81.
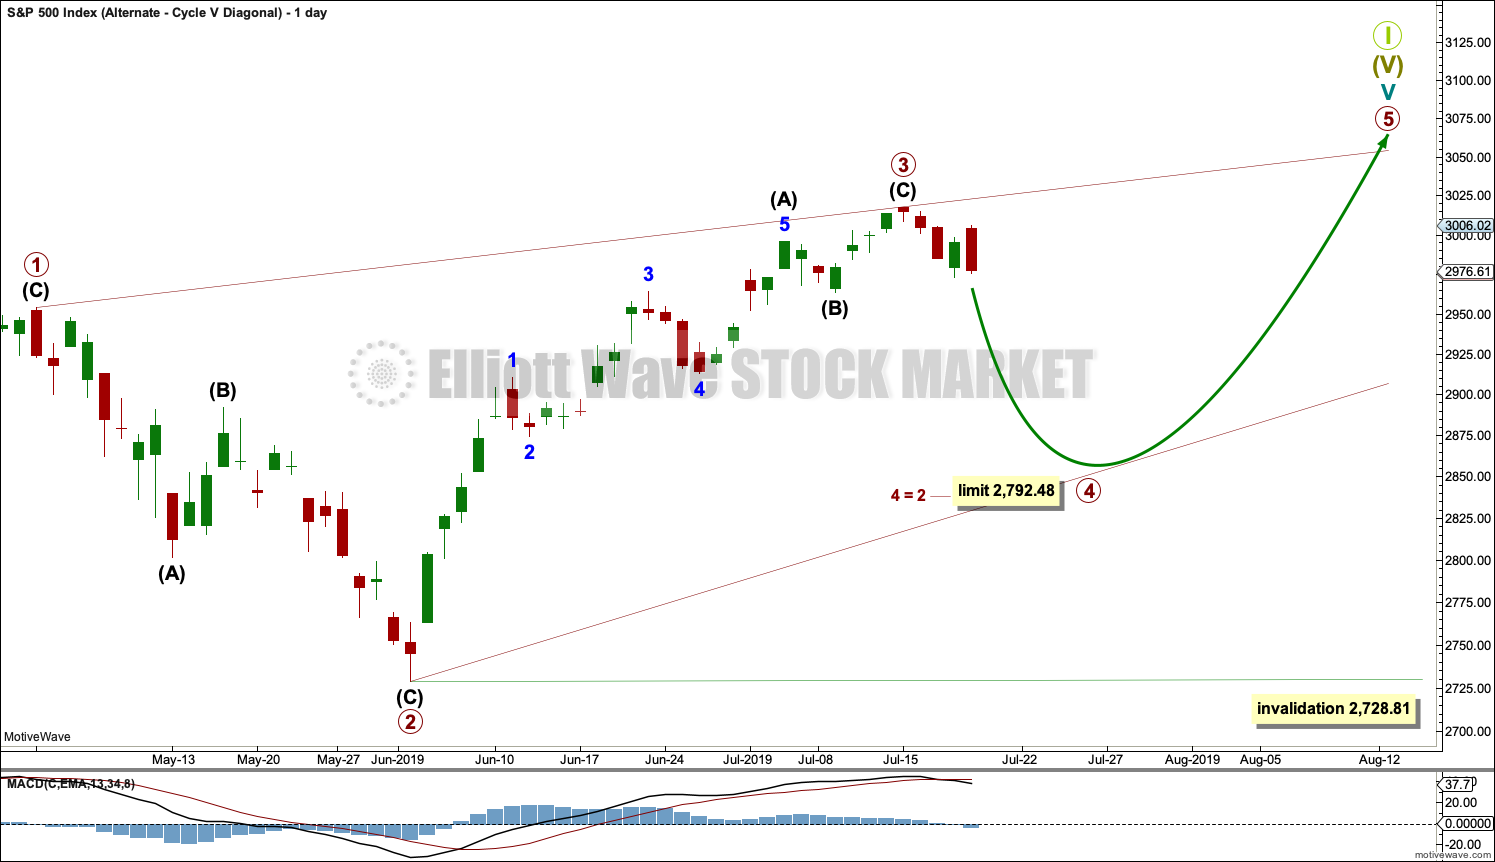
Cycle wave V may subdivide either as an impulse or an ending diagonal. Impulses are much more common. Ending diagonals normally have second and fourth waves that are deep; the common depth is from 0.66 to 0.81 the prior wave. So far a correction within cycle wave V has not been deeper than 0.5, so a diagonal at this stage looks very unlikely (but remains possible).
In historic analysis, two further monthly charts have been published that do not have a limit to upwards movement and are more bullish than this wave count. Members are encouraged to consider those possibilities (links below summary) alongside the wave counts presented on a daily and weekly basis.
Daily charts below will now focus on price movement from the high of primary wave 1.
DAILY CHART
Click chart to enlarge.
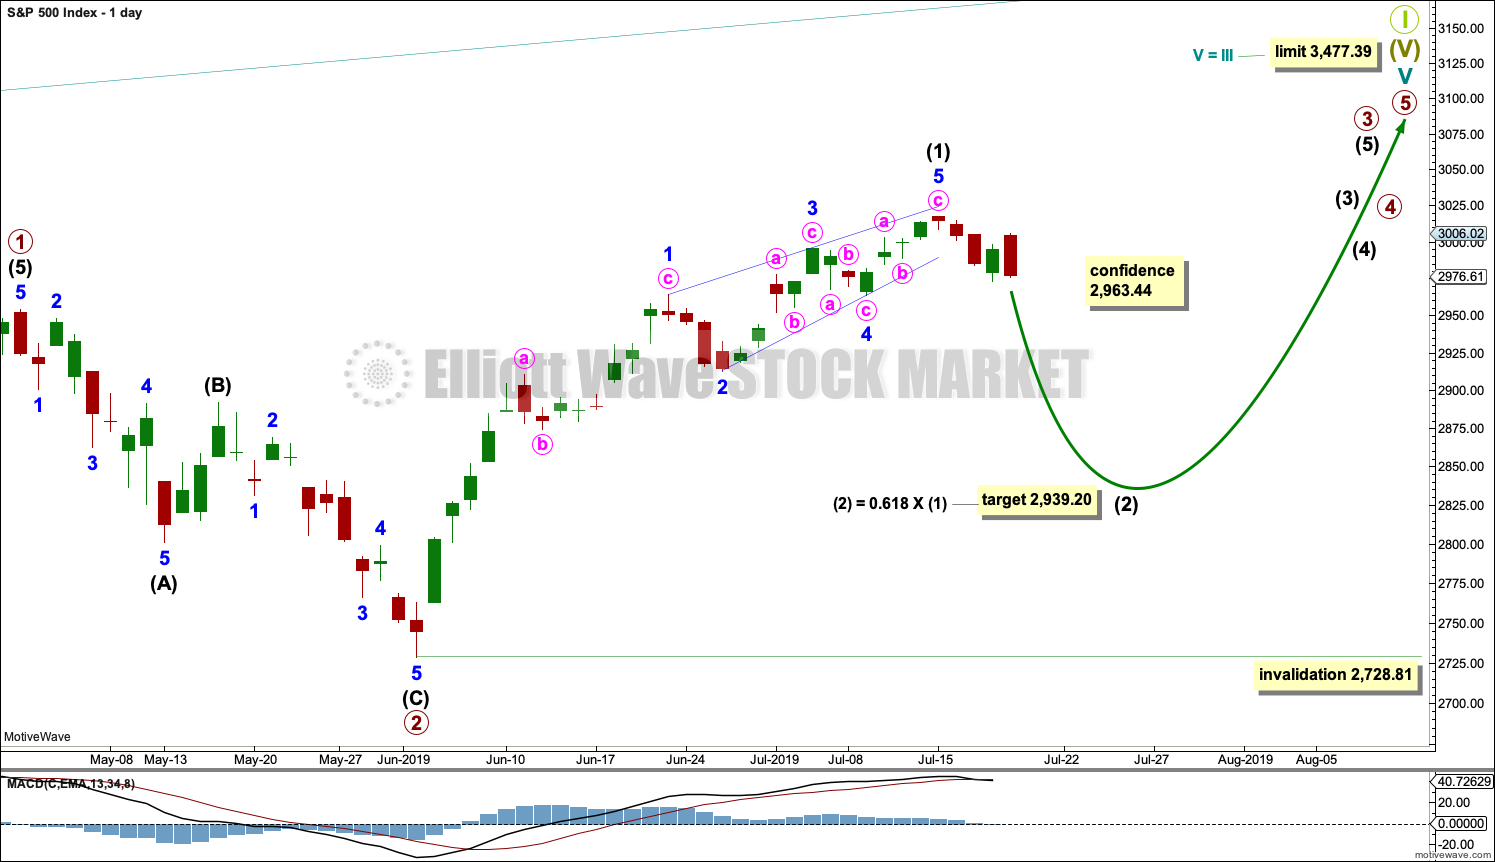
Cycle wave V must subdivide as a five wave motive structure. Within that five wave structure, primary waves 1 and 2 may be complete.
Primary wave 3 must move above the end of primary wave 1 (this rule has now been met). Primary wave 3 may only subdivide as an impulse.
Within the impulse of primary wave 3, intermediate wave (1) may be complete.
At the end of this week, the wave count at the daily chart level is changed after a judgement made from classic technical analysis. Thank you to Kevin for charting this idea.
It is possible that intermediate wave (1) was over at the last high as a leading contracting diagonal. Within the diagonal, all sub-waves appear to be zigzags, as they most commonly are within leading diagonals. Minor wave 4 overlaps minor wave 1 price territory, as it must within a diagonal. The trend lines converge. This structure meets all Elliott wave rules.
Second wave corrections following leading diagonals in first wave positions are commonly very deep. Intermediate wave (2) may be expected to reach down to the 0.618 Fibonacci ratio of intermediate wave (1) or below.
Intermediate wave (2) may not move beyond the start of intermediate wave (1) below 2,728.81.
Intermediate wave (2) may last a few weeks.
ALTERNATE DAILY CHART
Click chart to enlarge.
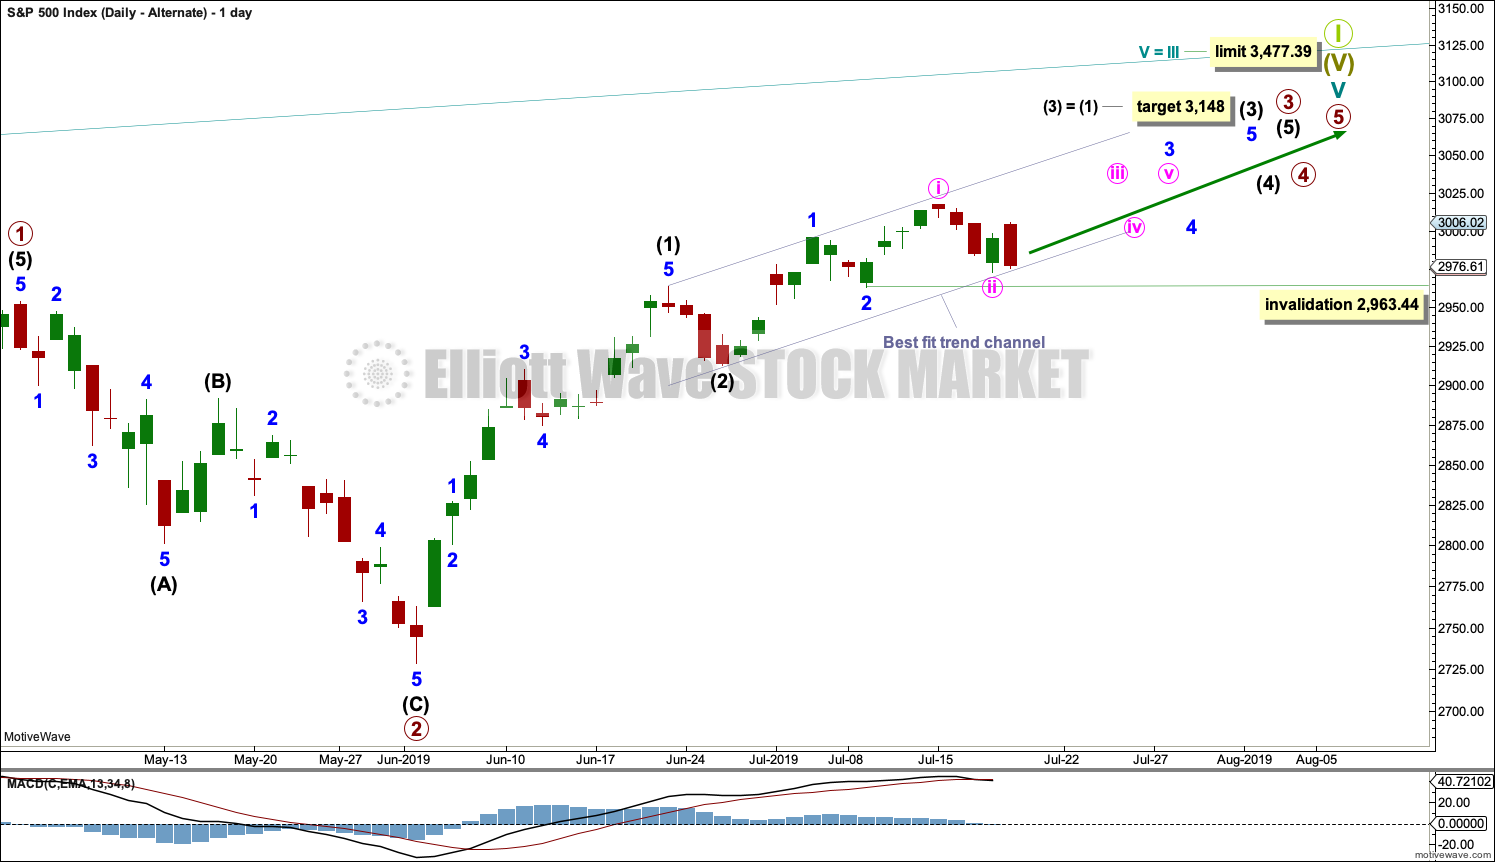
Up until the end of this week, this was the main wave count. Today it is judged to be an alternate.
It remains possible that within primary wave 3 both intermediate waves (1) and (2) are complete. Within intermediate wave (3), both minor waves 1 and 2 may be complete. Within minor wave 3, minute wave ii should be over at the last low if it is to remain within the best fit channel.
Minute wave ii may not move beyond the start of minute wave i below 2,963.44.
SECOND WAVE COUNT
WEEKLY CHART
Click chart to enlarge.
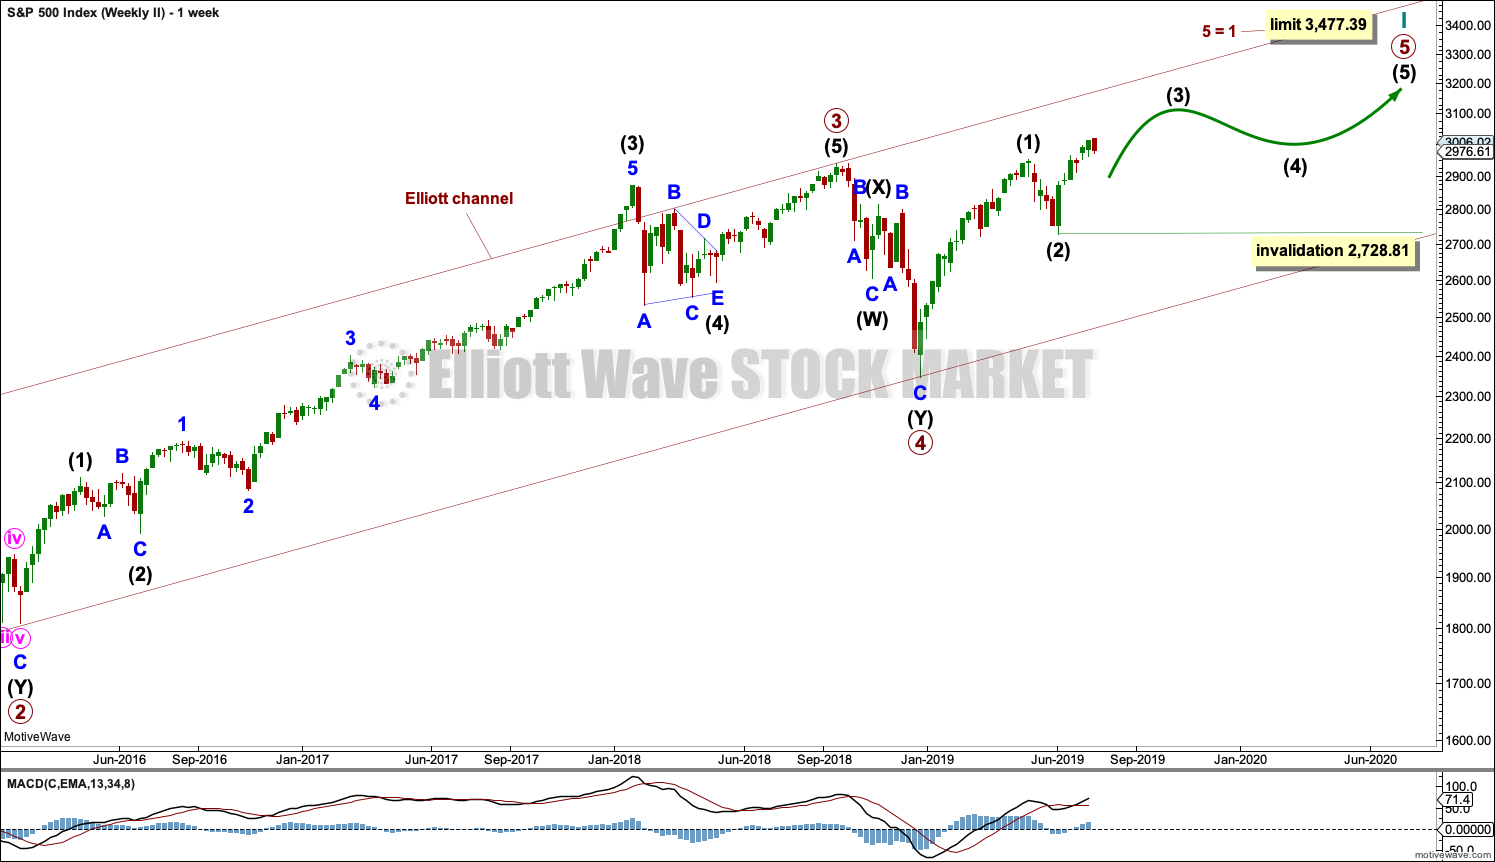
This weekly chart is almost identical to the first weekly chart, with the sole exception being the degree of labelling.
This weekly chart moves the degree of labelling for the impulse beginning in March 2009 all down one degree. This difference is best viewed on monthly charts.
The impulse is still viewed as nearing an end; a fifth wave is still seen as needing to complete higher. This wave count labels it primary wave 5.
SECOND ALTERNATE WAVE COUNT
DAILY CHART
Click chart to enlarge.
For publication at the end of this week only, another structure is possible for cycle wave V.
The first two daily charts above expect that cycle wave V may be unfolding as an impulse, which is much more likely. This second alternate looks at the less likely structure of an ending diagonal.
Ending diagonals require all sub-waves to subdivide as zigzags. The fourth wave must overlap first wave price territory. The most common type are contracting diagonals, where the third wave is shorter than the first, the fifth wave is shorter than the third, the fourth wave is shorter than the second and the trend lines converge.
In this possible diagonal primary wave 3 is shorter than primary wave 1. Primary wave 4 must be shorter than primary wave 2 for the rule to be met.
This wave count expects a relatively quick end to cycle wave V. Because at this stage there is no divergence between price and the AD line this wave count has a very low probability. It will not be published again for this reason. I will follow this possibility and will publish it again if it is necessary.
TECHNICAL ANALYSIS
WEEKLY CHART
Click chart to enlarge. Chart courtesy of StockCharts.com.
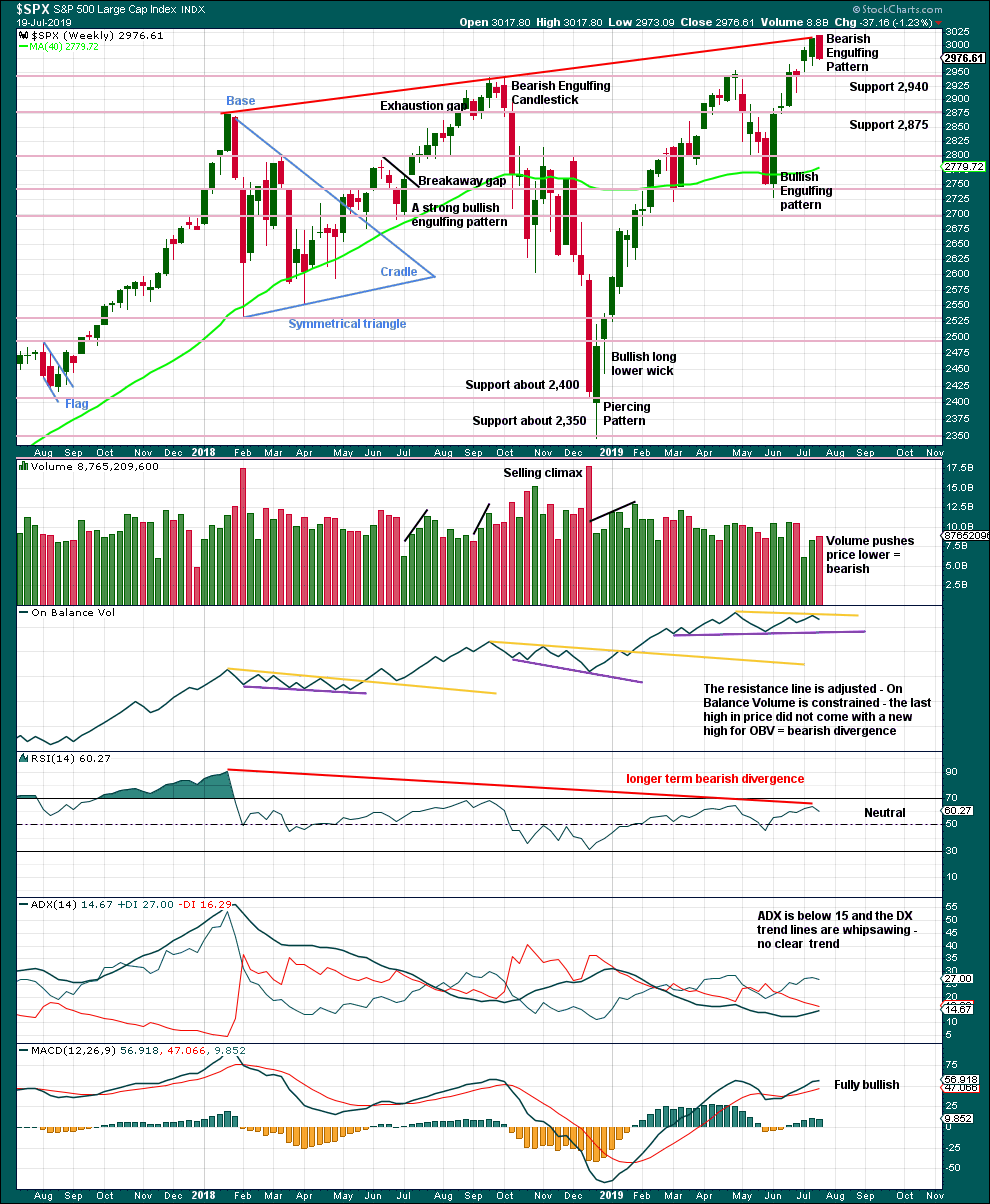
This week completes a strong Bearish Engulfing candlestick pattern. Coming after an upwards movement, this is a reversal pattern. It has support from volume; it is taken seriously in this analysis.
The red line illustrating bearish divergence is also a resistance line, which was perfectly met this week.
Longer-term bearish divergence between price and RSI fits the Elliott wave count: the most extreme reading from RSI corresponds with the end of a third wave, and now a fifth wave at cycle or primary degree exhibits some weakness compared to the third wave.
DAILY CHART
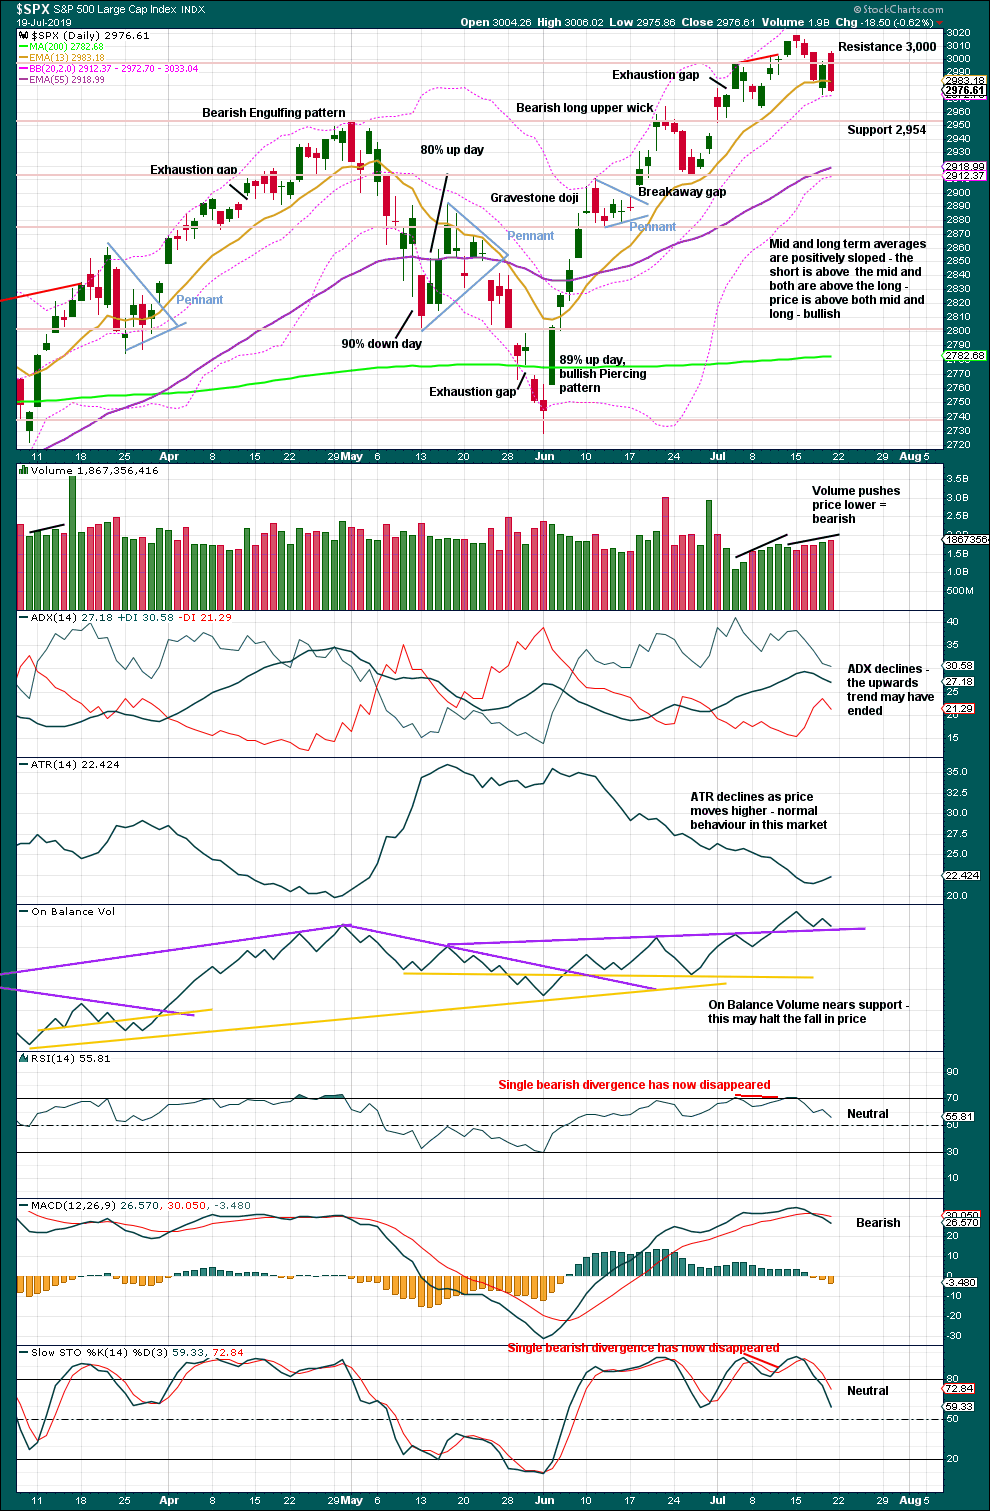
Click chart to enlarge. Chart courtesy of StockCharts.com.
Volume suggests the pullback is still not over.
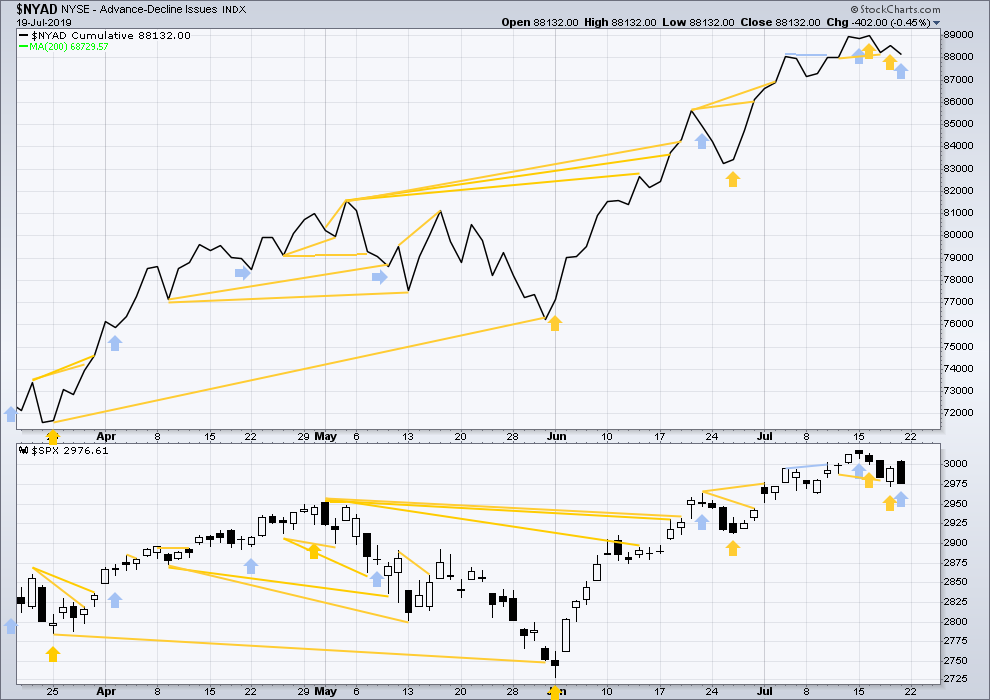
BREADTH – AD LINE
WEEKLY CHART
Click chart to enlarge. Chart courtesy of StockCharts.com. So that colour blind members are included, bearish signals
will be noted with blue and bullish signals with yellow.
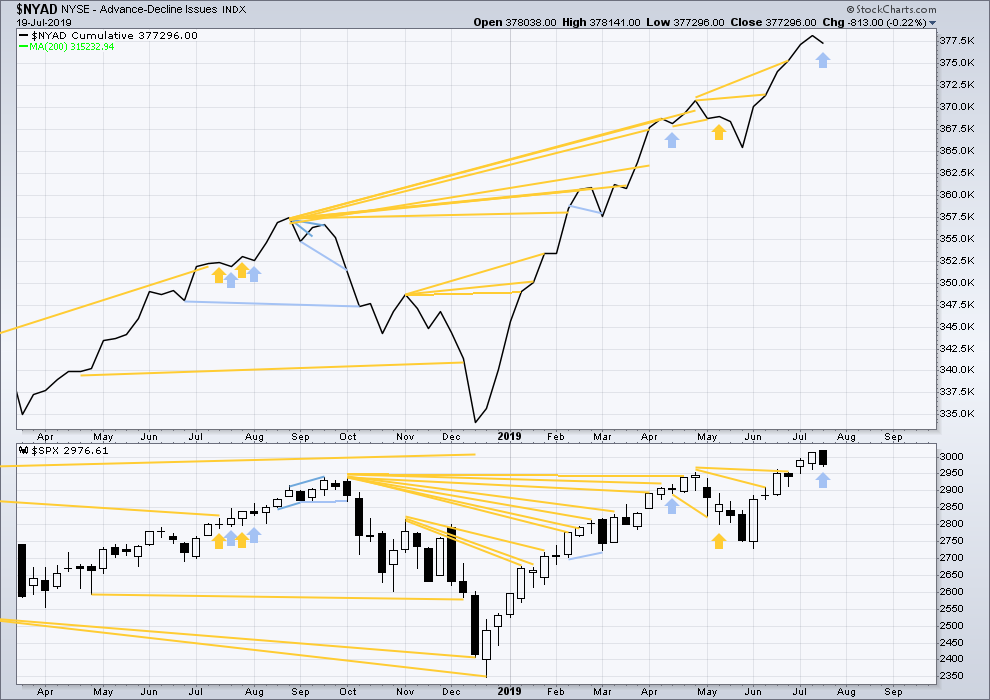
Bear markets from the Great Depression and onwards have been preceded by an average minimum of 4 months divergence between price and the AD line with only two exceptions in 1946 and 1976. With the AD line making new all time highs again this week, the end of this bull market and the start of a new bear market is very likely a minimum of 4 months away, which is mid November 2019.
In all bear markets in the last 90 years there is some positive correlation (0.6022) between the length of bearish divergence and the depth of the following bear market. No to little divergence is correlated with more shallow bear markets. Longer divergence is correlated with deeper bear markets.
If a bear market does develop here, it comes after no bearish divergence. It would therefore more likely be shallow.
Last week the AD line again makes new all time highs with price. Upwards movement has good support from rising market breadth, indicating a healthy bull market.
This week price has moved higher with a higher high and a higher low, although the candlestick has closed red. The AD line has declined. This is short-term bearish divergence.
Mid caps remain below their all time high of 24th April 2019, and small caps remain below their all time high of 25th February 2019. Weakness is beginning to develop in small caps and mid caps. This is normal behaviour during the later stages of a bull market, and may be expected to develop further before the bull market may end. Tops are a process and that process may last months to even years.
DAILY CHART
Click chart to enlarge. Chart courtesy of StockCharts.com. So that colour blind members are included, bearish signals
will be noted with blue and bullish signals with yellow.
Breadth should be read as a leading indicator.
Short-term bullish divergence noted on Thursday was followed by some upwards movement within Friday with a higher high and a higher low. It may now be resolved.
Friday’s session saw a higher high and a higher low, but the AD line has declined. For the short term, this divergence is bearish.
VOLATILITY – INVERTED VIX CHART
WEEKLY CHART
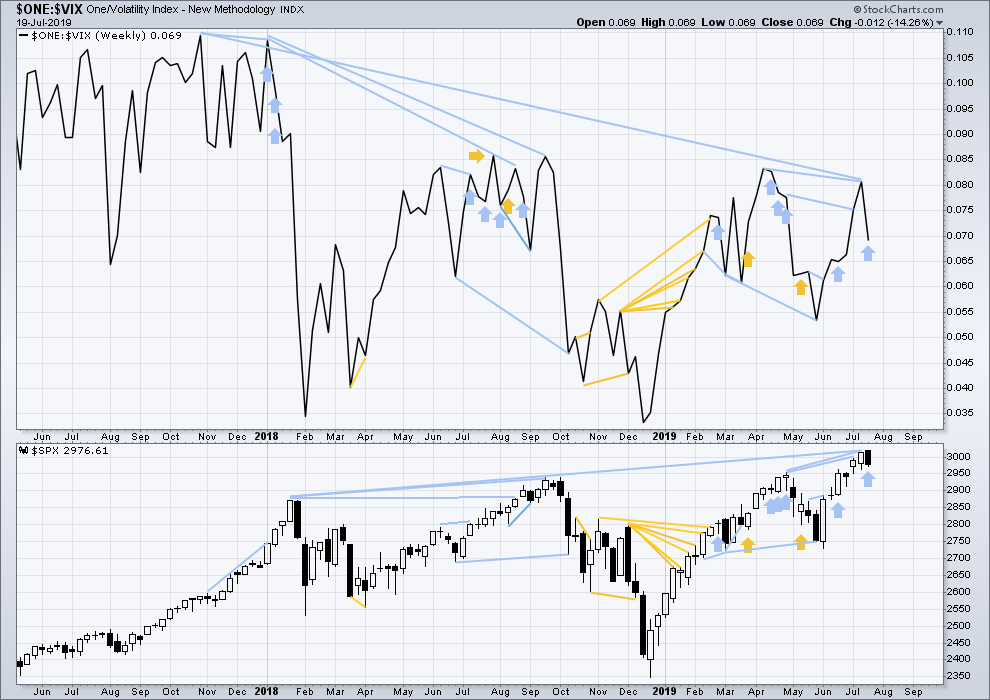
Click chart to enlarge. Chart courtesy of StockCharts.com. So that colour blind members are included, bearish signals
will be noted with blue and bullish signals with yellow.
The all time high for inverted VIX (which is the same as the low for VIX) was on 30th October 2017. There is now nearly one year and eight months of bearish divergence between price and inverted VIX.
The rise in price is not coming with a normal corresponding decline in VIX; VIX remains elevated. This long-term divergence is bearish and may yet develop further as the bull market matures.
This divergence may be an early warning, a part of the process of a top developing that may take years. It may not be useful in timing a trend change.
This week inverted VIX has moved lower while price has moved higher. This divergence is bearish.
DAILY CHART
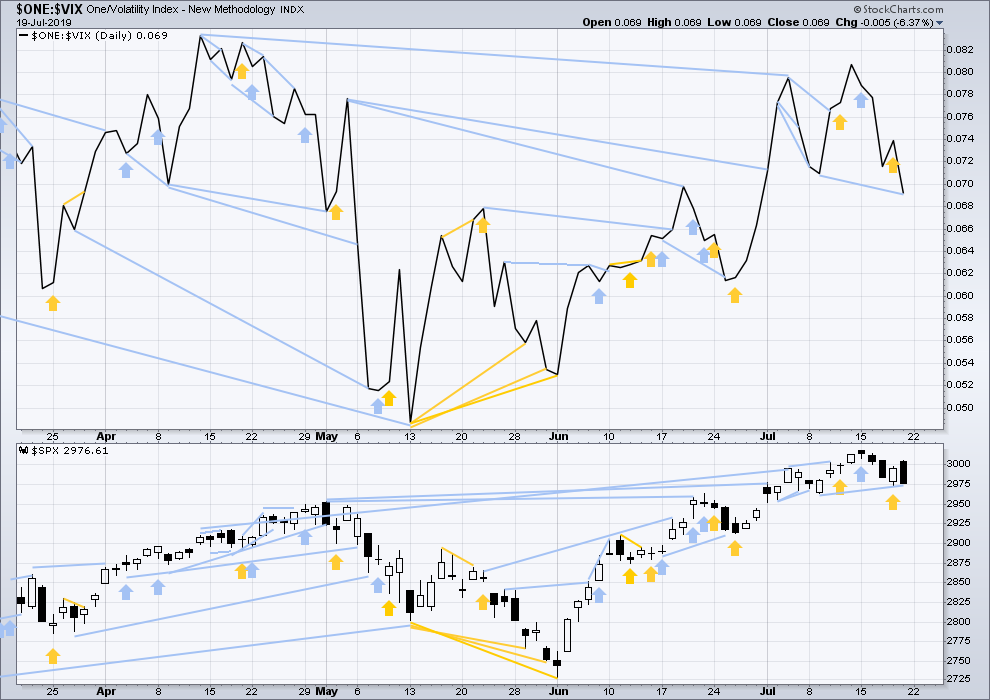
Click chart to enlarge. Chart courtesy of StockCharts.com. So that colour blind members are included, bearish signals
will be noted with blue and bullish signals with yellow.
Inverted VIX has made a new swing low below the prior low of the 9th of July, but price has not. This divergence is bearish.
DOW THEORY
Dow Theory confirmed a bear market in December 2018. This does not necessarily mean a bear market at Grand Super Cycle degree though; Dow Theory makes no comment on Elliott wave counts. On the 25th of August 2015 Dow Theory also confirmed a bear market. The Elliott wave count sees that as part of cycle wave II. After Dow Theory confirmation of a bear market in August 2015, price went on to make new all time highs and the bull market continued.
DJIA: 23,344.52 – a close on the 19th of December at 23,284.97 confirms a bear market.
DJT: 9,806.79 – price has closed below this point on the 13th of December.
S&P500: 2,532.69 – a close on the 19th of December at 2,506.96 provides support to a bear market conclusion.
Nasdaq: 6,630.67 – a close on the 19th of December at 6,618.86 provides support to a bear market conclusion.
With all the indices having moved higher following a Dow Theory bear market confirmation, Dow Theory would confirm a bull market if the following highs are made:
DJIA: 26,951.81 – a close above this point has been made on the 3rd of July 2019.
DJT: 11,623.58 – to date DJT has failed to confirm an ongoing bull market.
S&P500: 2,940.91 – a close above this point was made on the 29th of April 2019.
Nasdaq: 8,133.30 – a close above this point was made on the 26th of April 2019.
GOLD
The first target at 1,452 was almost met this week with a high at 1,450.65.
Summary: A sharp reversal and bearish candlestick pattern on the daily chart puts the breakout in some doubt.
Both bullish and bearish Elliott wave counts remain valid. The bearish case has some support from classic technical analysis after Friday’s sharp reversal. Confidence may be had if price makes a new low below 1,346.45.
The bullish Elliott wave count now expects a continuation of upwards movement next week to 1,565.
Grand SuperCycle analysis is here.
Last monthly charts are here.
Overall, the bearish wave counts still have a higher probability based upon Elliott wave structures. However, it would be best to leave price to invalidate either the bullish or bearish scenario before having confidence in which is correct.
BEARISH ELLIOTT WAVE COUNTS
MAIN WEEKLY CHART
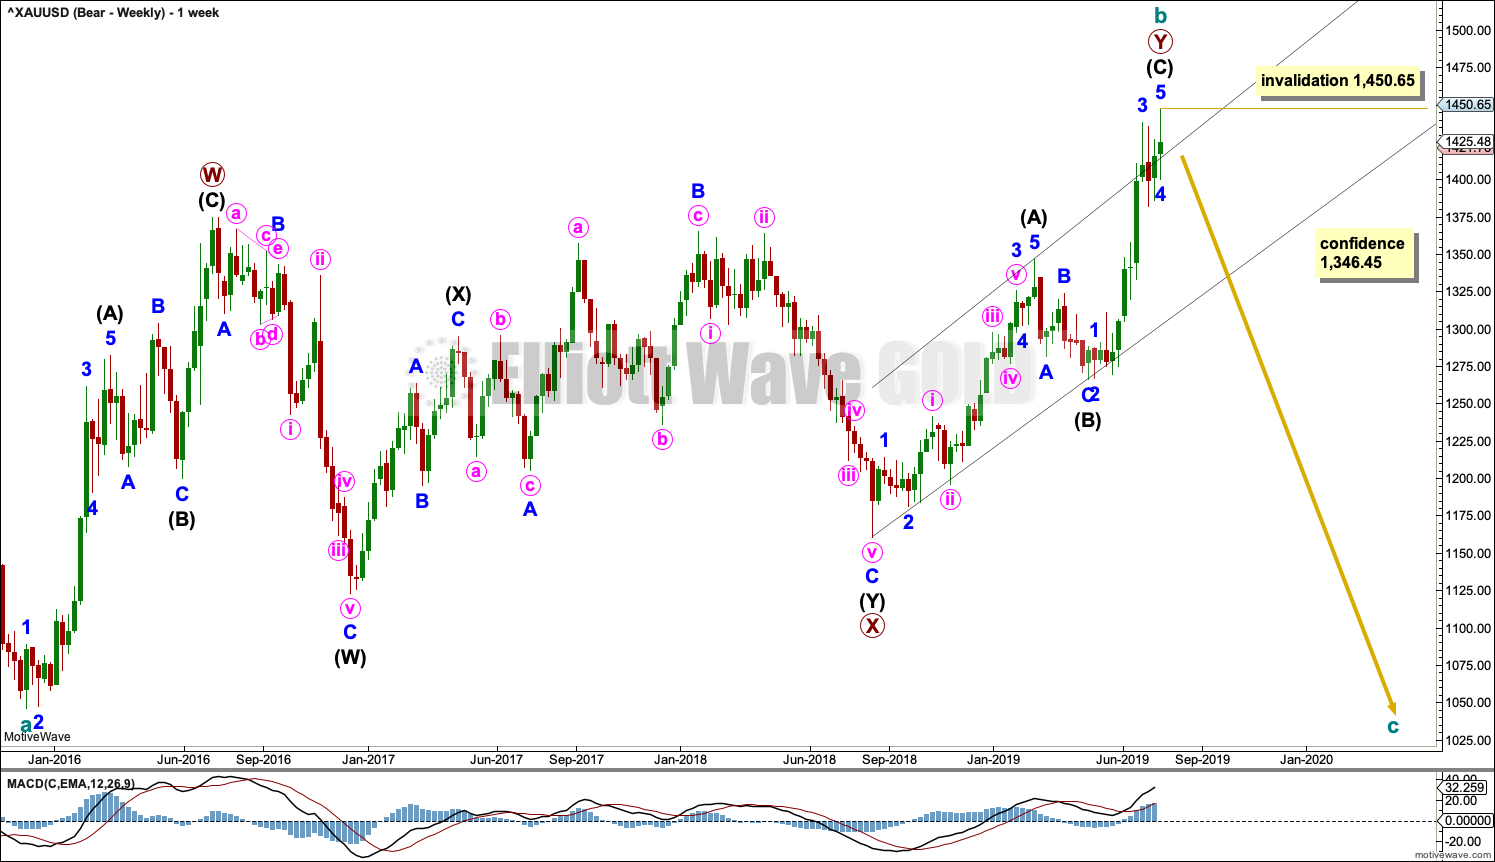
Click chart to enlarge.
It remains possible that the bear market for Gold may yet continue. It is possible that cycle wave b may be complete. Cycle wave b may be a double zigzag.
Double zigzags are common structures, but within them their X waves are almost always single zigzags that are relatively brief and shallow. However, this wave count sees primary wave X as a complete double combination: zigzag – X – expanded flat.
An X wave may occasionally subdivide as a multiple. In a multiple the maximum number of corrective structures is three: W, Y and Z. To label any one of W, Y or Z as a multiple would violate the Elliott wave rule. Here, the rule is met.
Primary wave Y may be a complete zigzag. Within the zigzag, intermediate wave (C) is just 0.52 short of equality in length with intermediate wave (A).
The purpose of a second zigzag in a double zigzag is to deepen the correction when the first zigzag does not move price far enough. This purpose has been achieved.
A new low now by any amount at any time frame below 1,346.45 would invalidate the bullish wave count below and provide some confidence in this wave count.
DAILY CHART
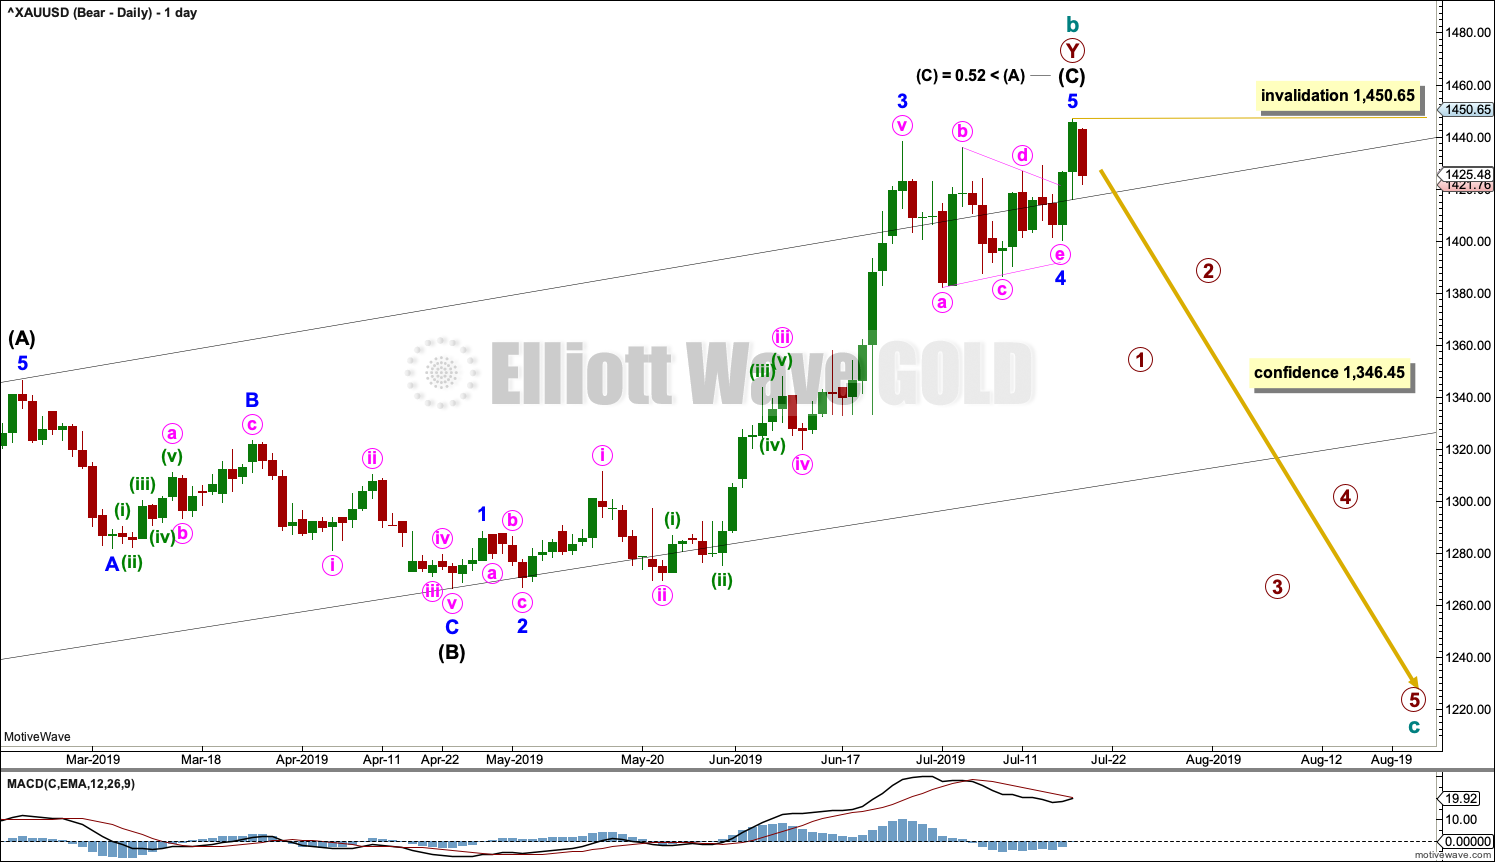
Click chart to enlarge.
This chart focusses on the impulse of intermediate wave (C).
Intermediate wave (C) may now be a complete impulse.
Gold often exhibits surprisingly short and brief fifth waves out of its fourth wave triangles, and this wave count expects that it may have done so here. This wave count follows common tendencies for this market.
Cycle wave c should move below the end of cycle wave a at 1,046.27 to avoid a truncation. Cycle wave c may only subdivide as a five wave structure, most likely an impulse. Within cycle wave c, primary wave 2 may not move beyond the start of primary wave 1 above 1,450.65.
ALTERNATE WEEKLY CHART
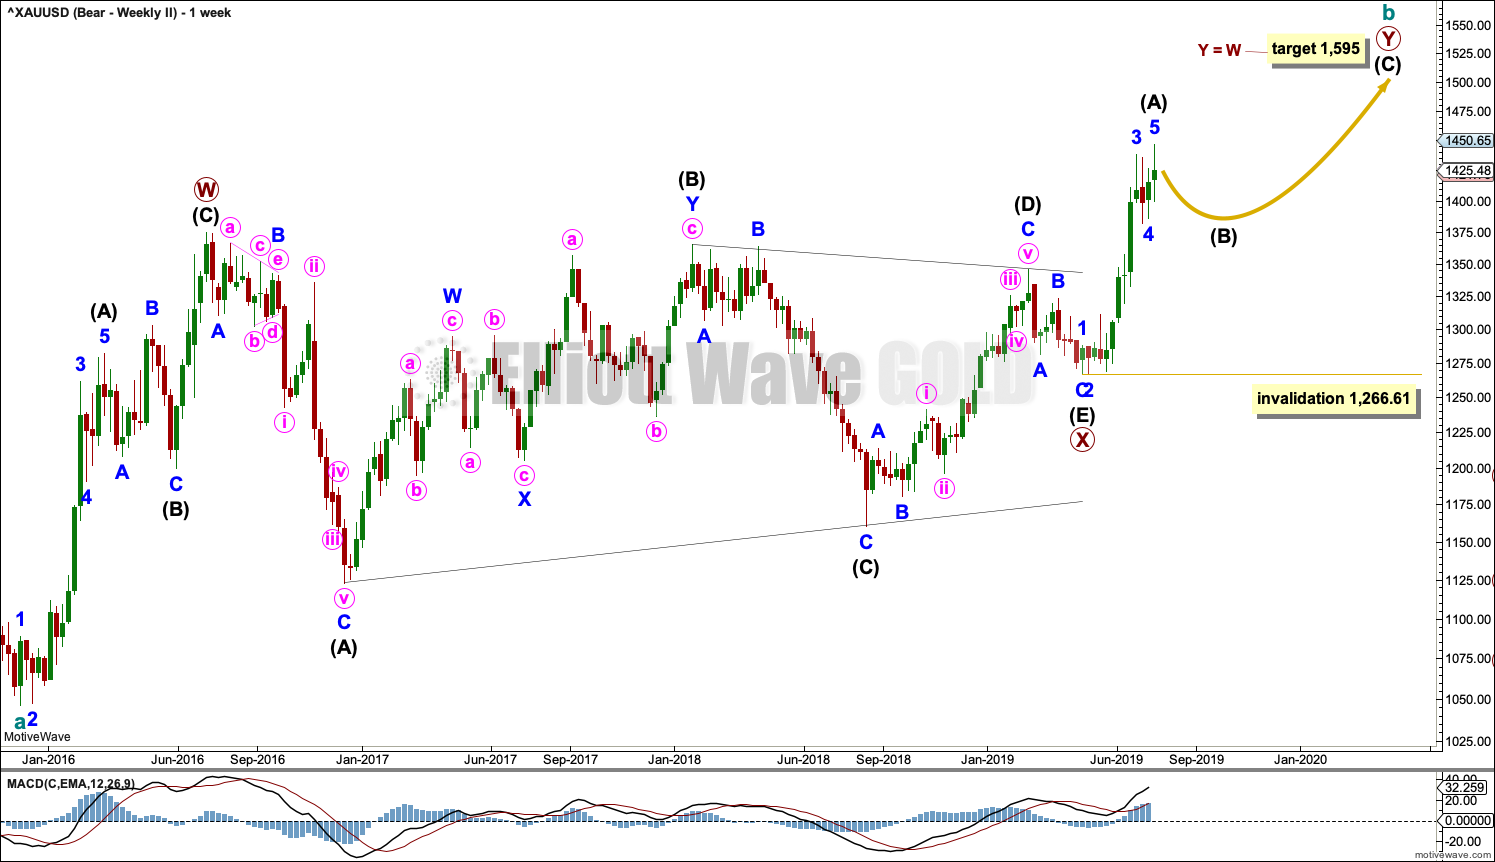
Click chart to enlarge.
This wave count has been published before. Now that it diverges from the main bearish wave count, it is time to publish it again.
It remains possible that cycle wave b is an incomplete double zigzag.
The first zigzag in the double is seen in the same way for both bearish wave counts, a zigzag labelled primary wave W.
This alternate bearish wave count sees primary wave X as a different structure, a regular contracting triangle, that ends at a different point. Primary wave Y must subdivide as a zigzag if cycle wave b is a double zigzag. Within primary wave Y, intermediate wave (A) may now be complete, and intermediate wave (B) may not move beyond the start of intermediate wave (A) below 1,266.61.
ALTERNATE DAILY CHART
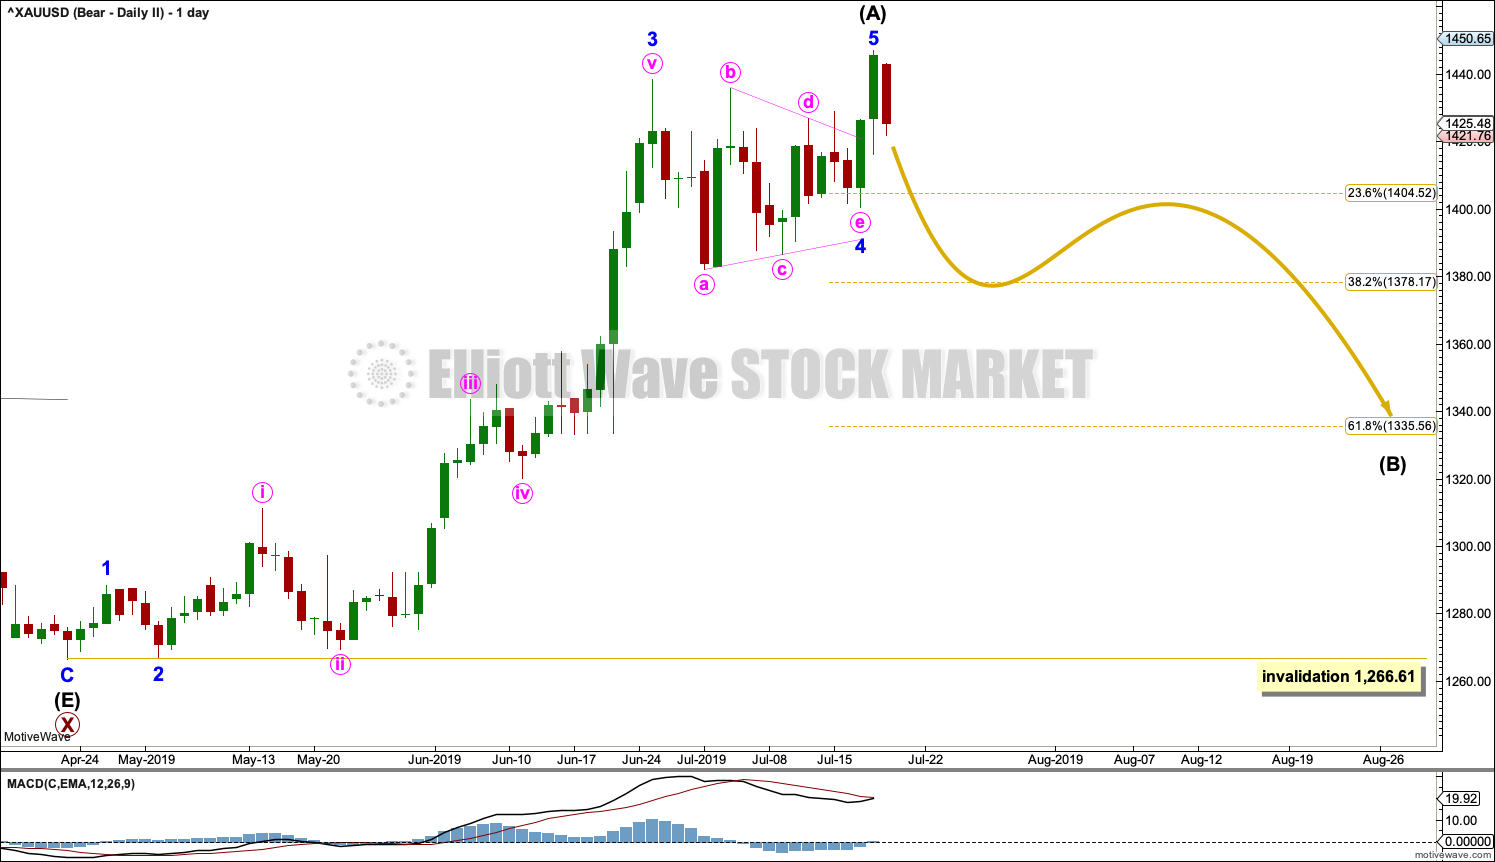
Click chart to enlarge.
Within primary wave Y, intermediate wave (A) may now be a complete five wave impulse.
Intermediate wave (B) may unfold over a few weeks. Intermediate wave (B) may subdivide as any one of more than 23 possible corrective Elliott wave structures. It may be a quick sharp pullback as a zigzag, or it may be a time consuming sideways consolidation as a combination, flat or triangle.
Intermediate wave (B) should exhibit weakness.
BULLISH ELLIOTT WAVE COUNT
WEEKLY CHART
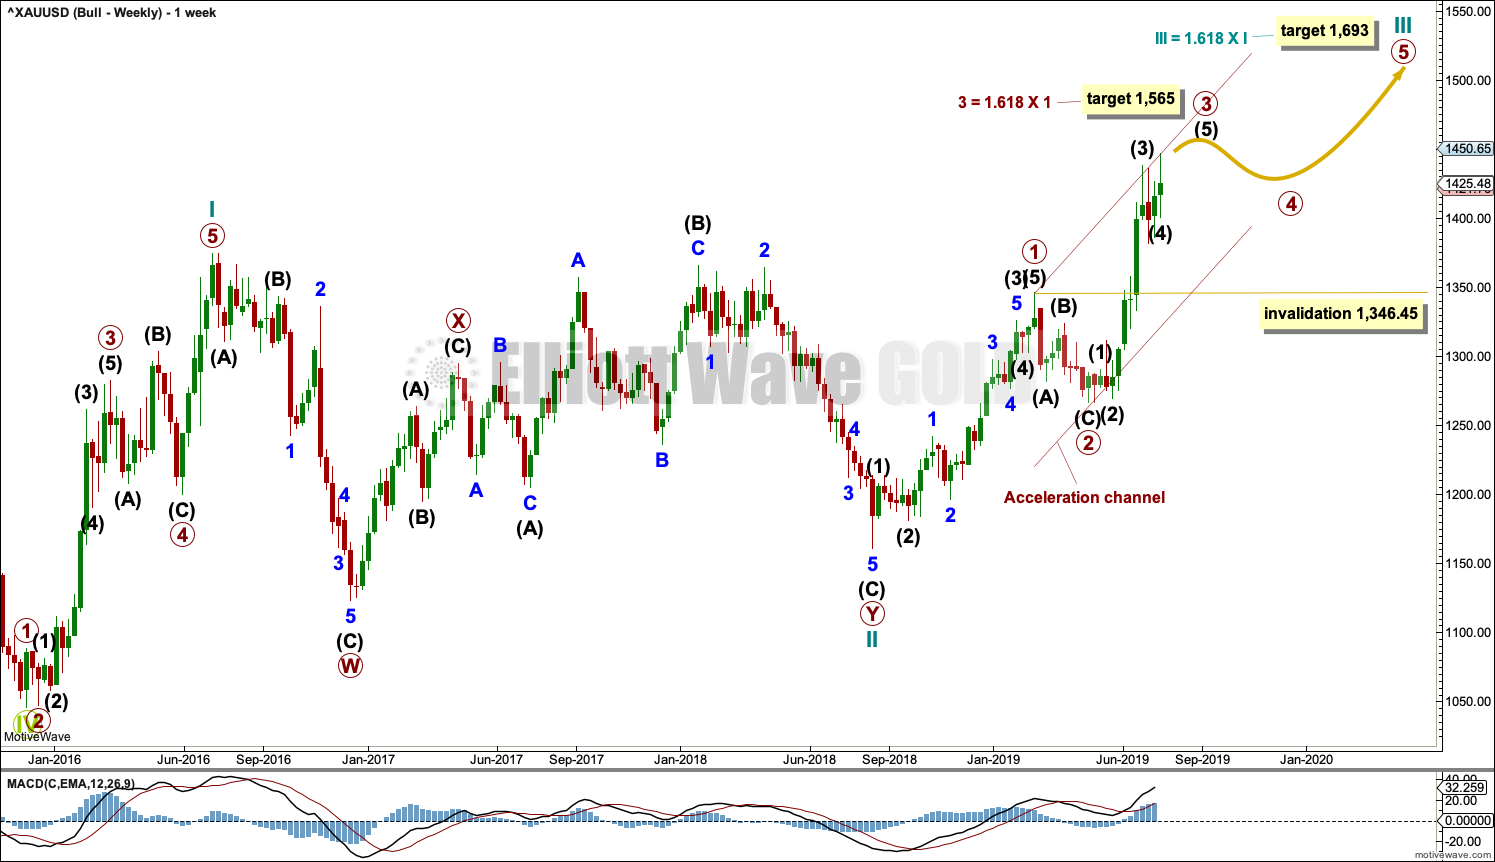
Click chart to enlarge.
This wave count sees the the bear market complete at the last major low for Gold in November 2015.
If Gold is in a new bull market, then it should begin with a five wave structure upwards on the weekly chart. However, the biggest problem with this wave count is the structure labelled cycle wave I because this wave count must see it as a five wave structure, but it looks more like a three wave structure.
Commodities often exhibit swift strong fifth waves that force the fourth wave corrections coming just prior and just after to be more brief and shallow than their counterpart second waves. It is unusual for a commodity to exhibit a quick second wave and a more time consuming fourth wave, and this is how cycle wave I is labelled. This wave count still suffers from this very substantial problem, and for this reason a bearish wave count is still considered above as it has a better fit in terms of Elliott wave structure.
Cycle wave II subdivides well as a double combination: zigzag – X – expanded flat.
Cycle wave III may have begun. Within cycle wave III, primary waves 1 and 2 may now be complete. If it continues lower as a double zigzag, then primary wave 2 may not move beyond the start of primary wave 1 below 1,160.75.
Cycle wave III so far for this wave count would have been underway now for 47 weeks. It may be beginning to exhibit some support from volume and increasing ATR. If this increase continues, then this wave count would have some support from technical analysis.
Draw an acceleration channel about primary waves 1 and 2: draw the first trend line from the end of primary wave 1 to the last high, then place a parallel copy on the last high. Keep redrawing the channel as price continues higher. When primary wave 3 is complete, then this channel would be drawn using Elliott’s first technique about the impulse. The lower edge may provide support.
Primary wave 4 may not move into primary wave 1 price territory below 1,346.45. Because the data used for this analysis is cash market data no overlap between primary waves 4 and 1 should be allowed. The invalidation point is absolute.
DAILY CHART
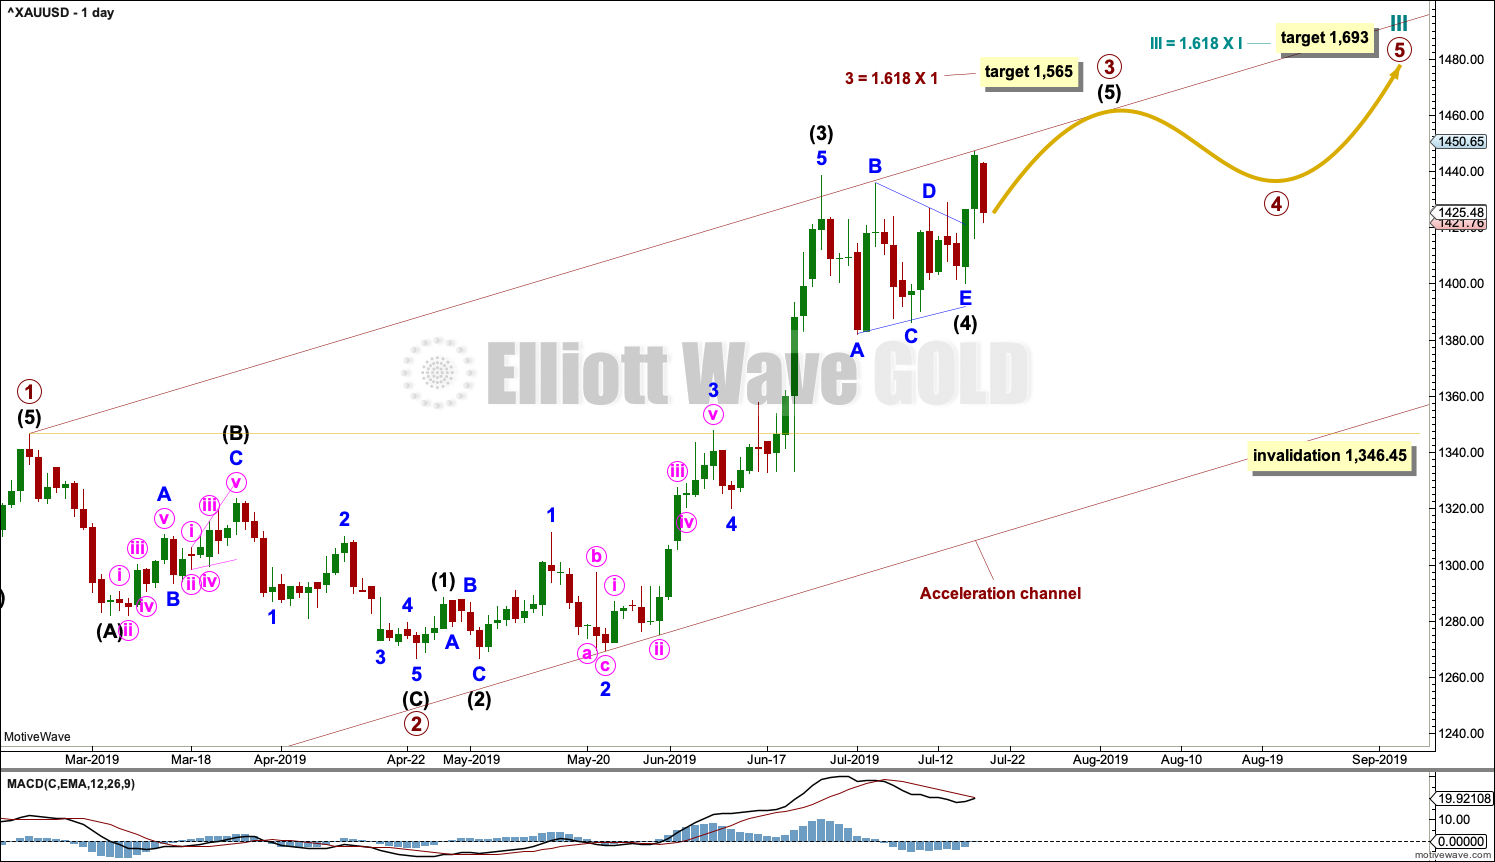
Click chart to enlarge.
This daily chart focusses on the impulse of primary wave 3.
Primary wave 3 may only subdivide as an impulse. Within the impulse, intermediate waves (1) through to (4) are all now complete. It is possible that intermediate wave (5) could be over at the last high, but for this wave count it would look more normal if it continued higher.
When it arrives, then primary wave 4 may not move into primary wave 1 price territory below 1,346.45.
TECHNICAL ANALYSIS
MONTHLY CHART
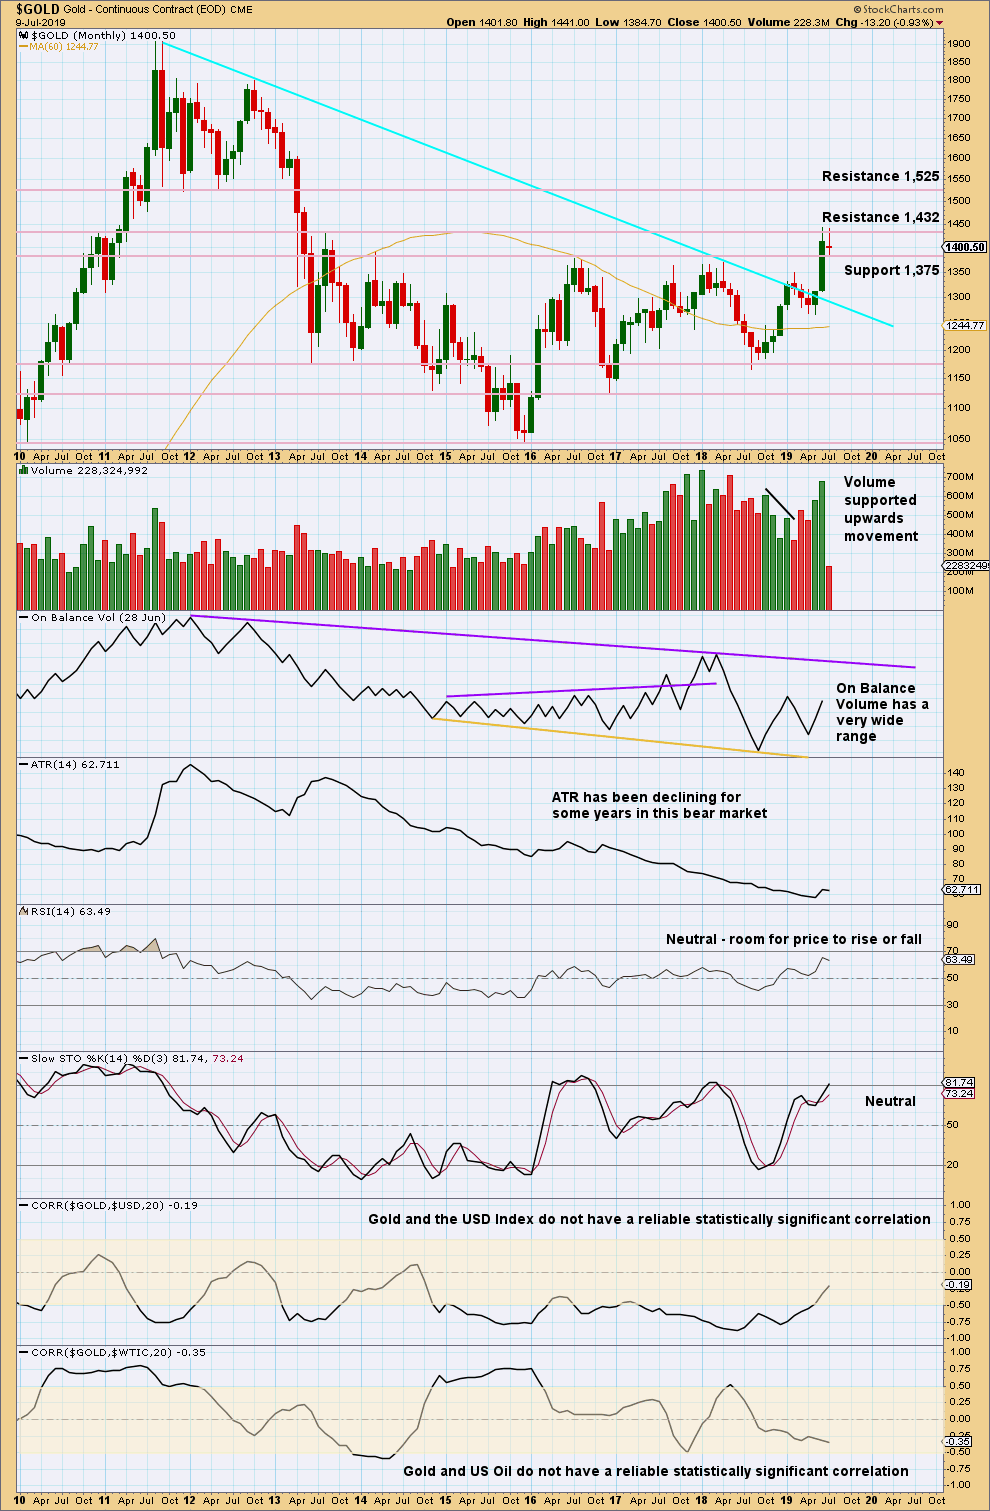
Click chart to enlarge. Chart courtesy of StockCharts.com.
Gold has effected an upwards breakout above multi-year resistance and above the cyan bear market trend line. Look for next resistance identified on the chart.
WEEKLY CHART
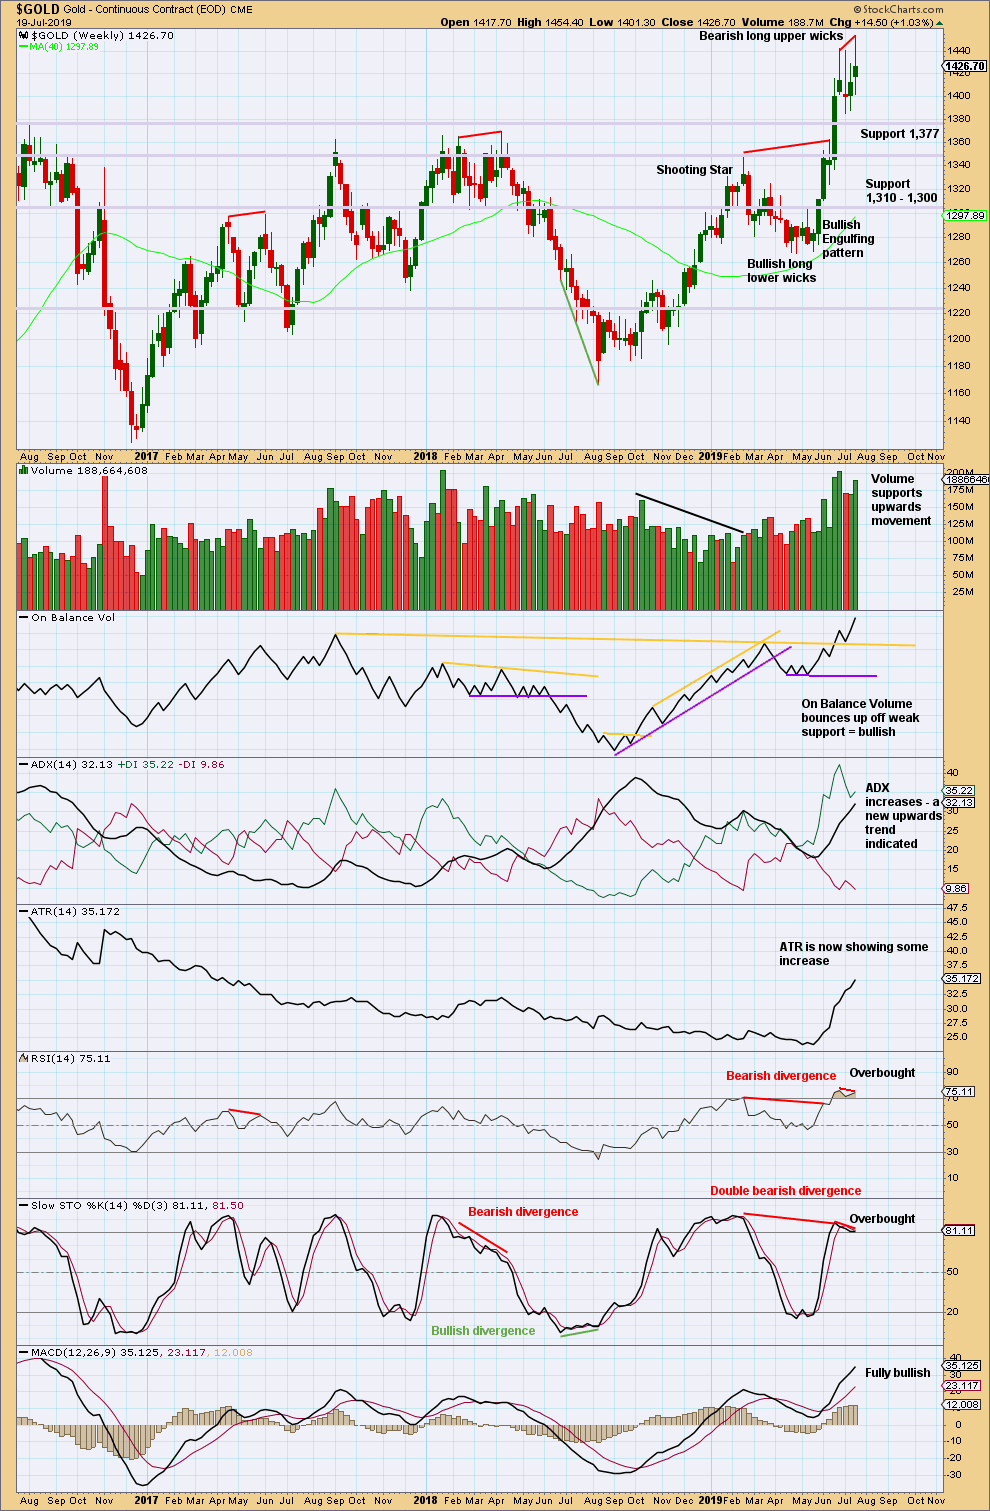
Click chart to enlarge. Chart courtesy of StockCharts.com.
A new high this week now exhibits some bearish divergence between price and RSI. However, as has been seen recently, sometimes this divergence simply disappears.
The bottom line remains that a multi year breakout occurred a few weeks ago, and it occurred with strength in volume. While price remains above support about 1,377 and ADX indicates an upwards trend, this chart will remain overall bullish.
DAILY CHART
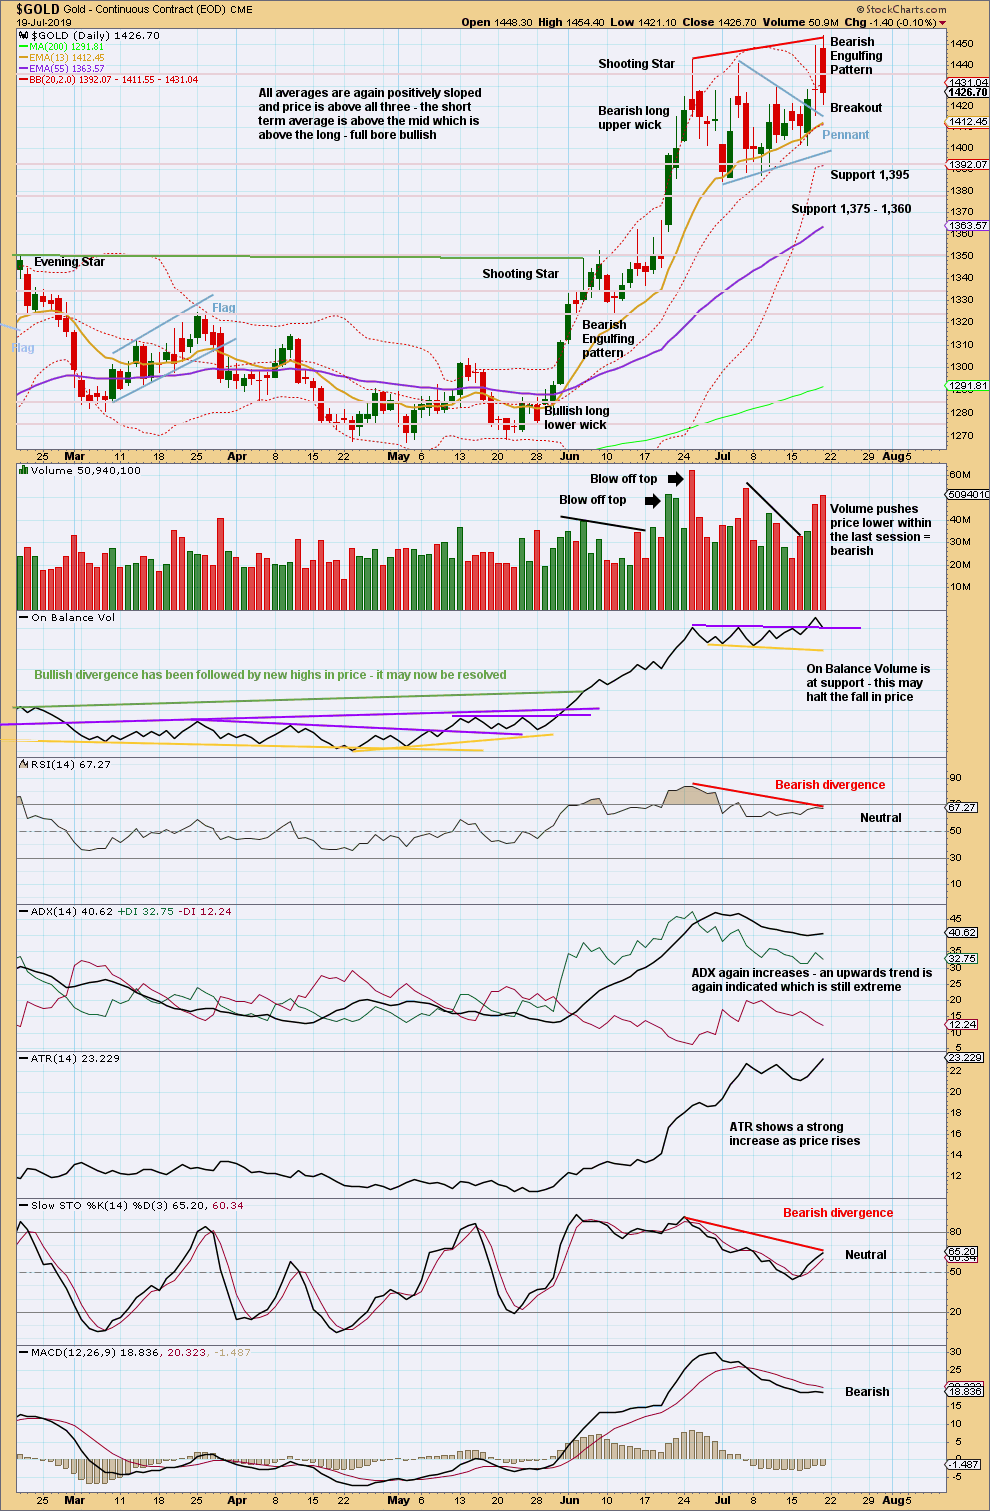
Click chart to enlarge. Chart courtesy of StockCharts.com.
The breakout from the pennant pattern looks suspicious after a sharp downturn on Friday. The target was not met.
Now a strong bearish reversal pattern has completed, which has support from volume. The upwards trend remains very extreme. RSI here reached overbought and now exhibits strong bearish divergence with price.
Look out for either another more time consuming consolidation to relieve extreme conditions before the upwards trend can resume, or a trend change. This is essentially the bullish and bearish case for the Elliott wave counts both seen in this chart.
GDX WEEKLY CHART
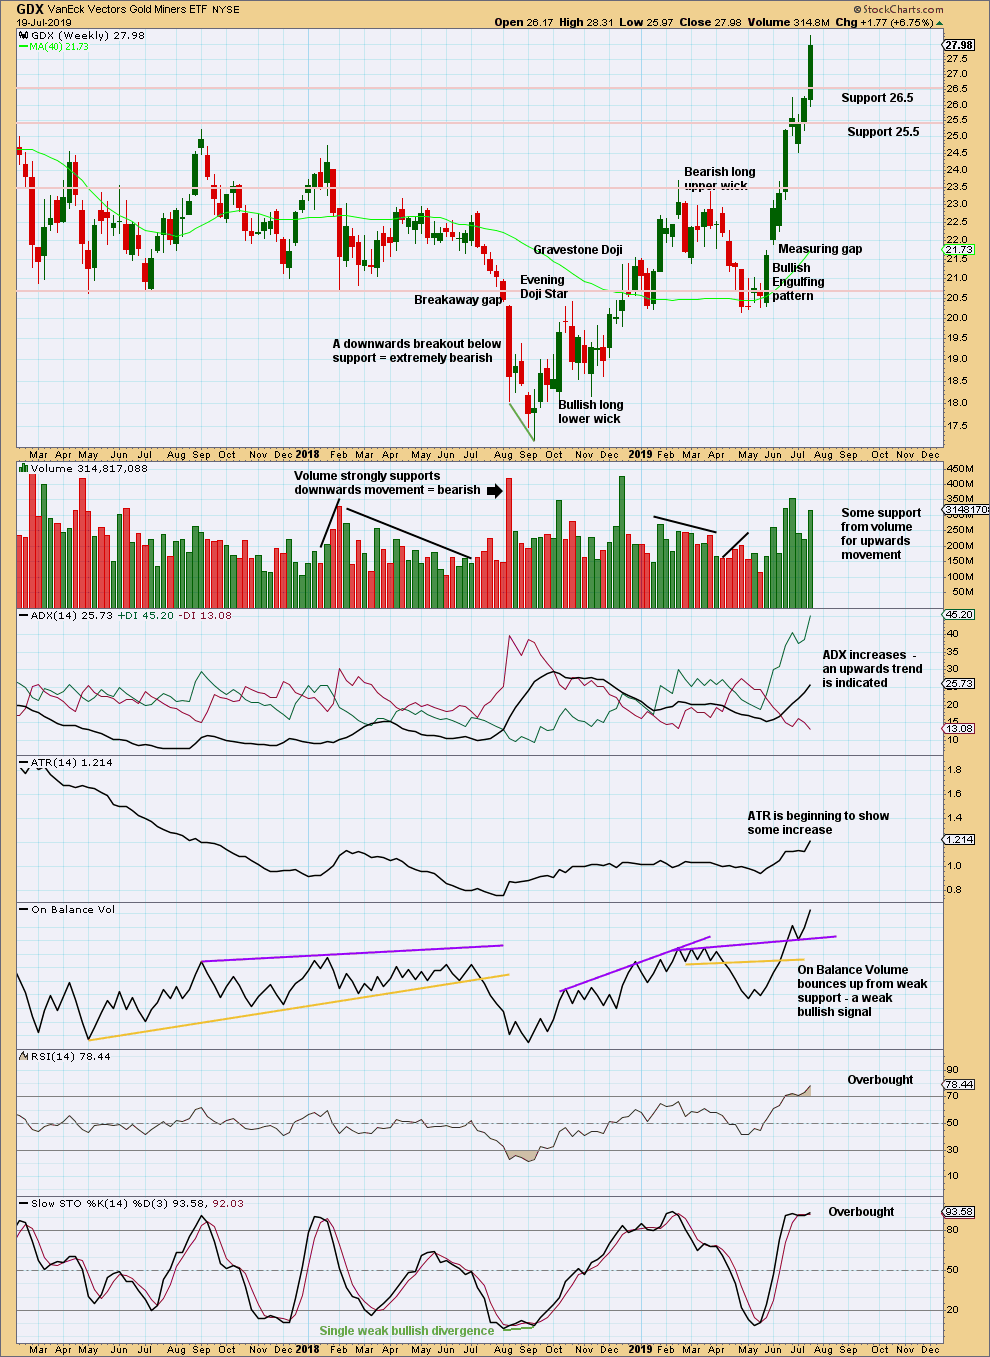
Click chart to enlarge. Chart courtesy of StockCharts.com.
The upwards trend continues, but conditions are now overbought. This can continue for a while during a strong trend. At this stage, there are no signs of a reversal.
This week volume offers some support to upwards movement.
GDX DAILY CHART
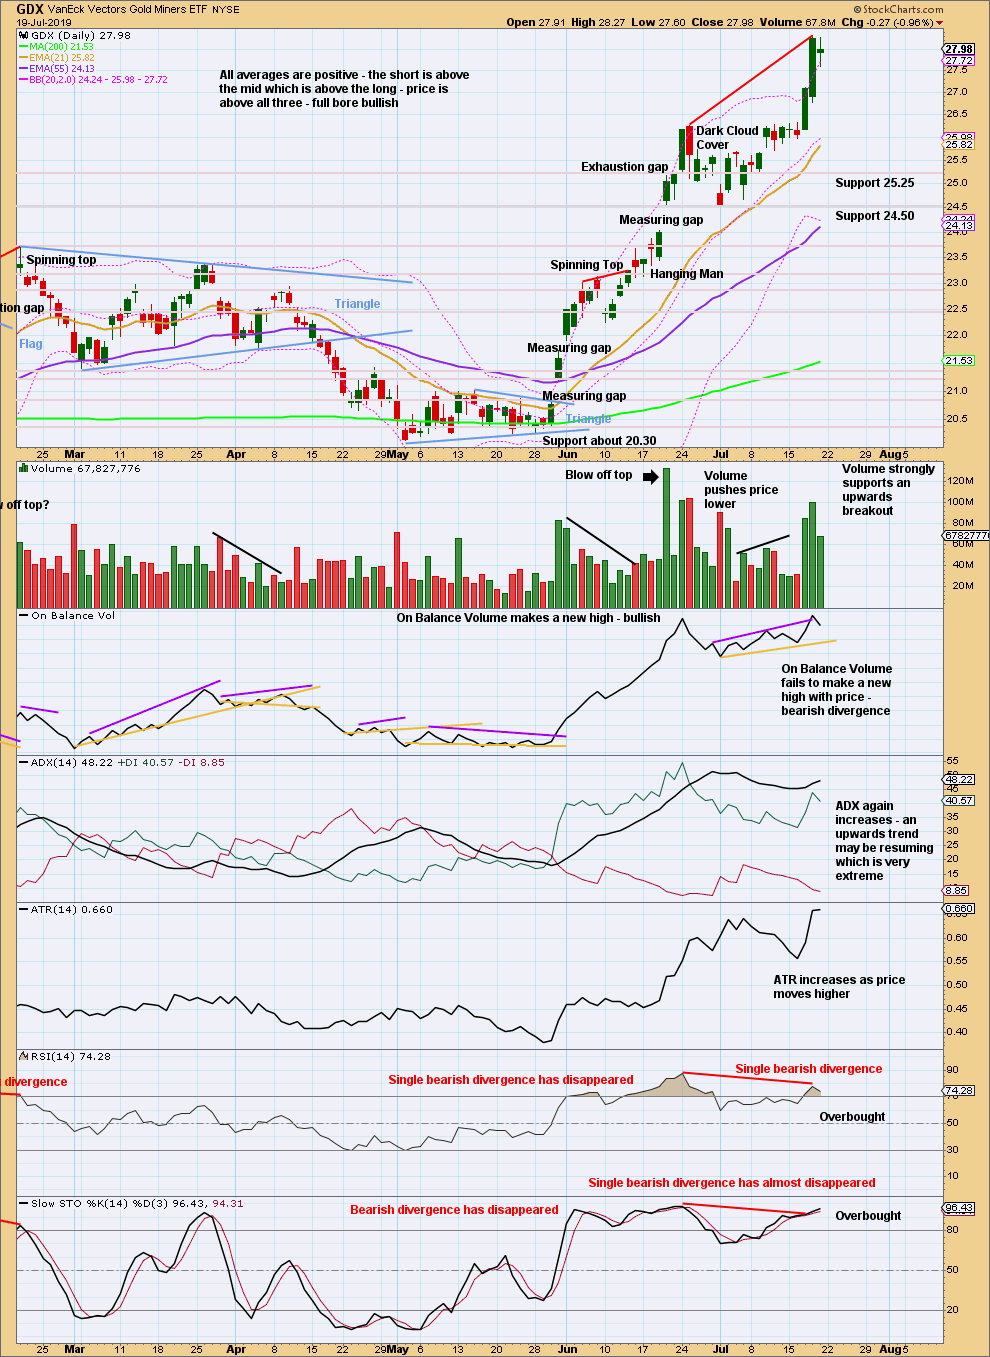
Click chart to enlarge. Chart courtesy of StockCharts.com.
A short-term target taken from the width of the last consolidation may be about 28.02.
The trend is very extreme and conditions are overbought, but there is still zero evidence of a trend change. Assume the trend remains the same until proven otherwise.
Proven otherwise would be a new swing low below 24.53 or a strong bearish candlestick reversal pattern.
US OIL
A bounce was expected to end very early within the week in the target zone from 60.53 to 61.74. No more upwards movement was seen. Price has turned within this target zone.
Summary: A new mid-term target is now at 35.25 for a third wave down. This may exhibit an increase in momentum, and may end with a capitulation spike.
The final target is calculated at 10.72. Confidence in this target may be had if price makes a new low below 50.61.
The bullish alternate wave count would have confidence above 66.59. At that stage, a target for a third wave to end would be at 89.80.
MAIN ELLIOTT WAVE COUNT
MONTHLY CHART
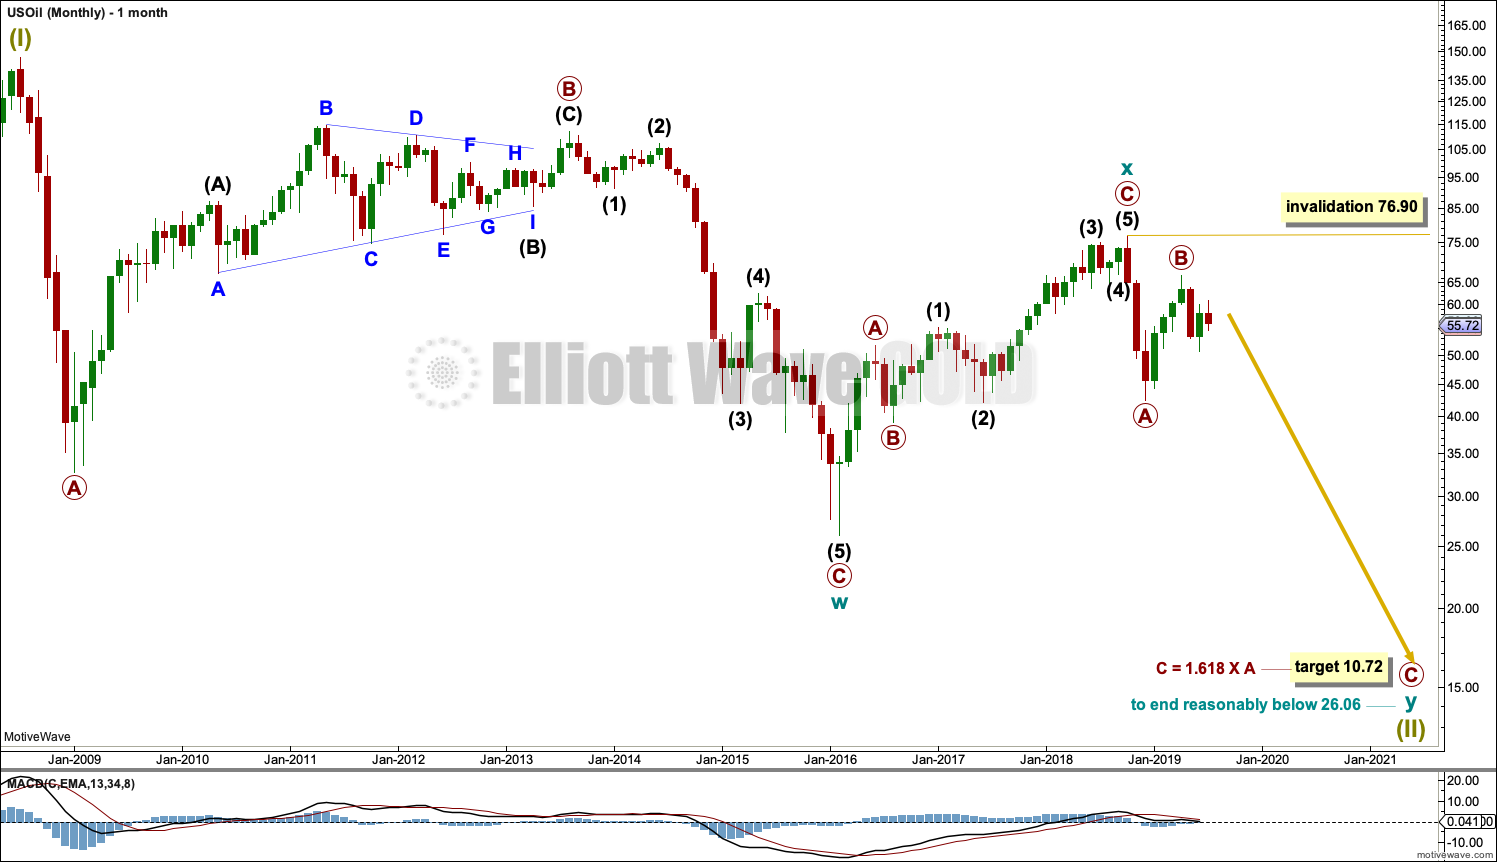
Click chart to enlarge.
The basic Elliott wave structure is five steps forward and three steps back. This Elliott wave count expects that US Oil is still within a three steps back pattern, which began in July 2008. The Elliott wave count expects that the bear market for US Oil continues.
This Elliott wave corrective structure is a double zigzag, which is a fairly common structure. The correction is labelled Super Cycle wave (II).
The first zigzag in the double is complete and labelled cycle wave y. The double is joined by a three in the opposite direction labelled cycle wave x, which subdivides as a zigzag. The second zigzag in the double may now have begun, labelled cycle wave w.
The purpose of a second zigzag in a double zigzag is to deepen the correction when the first zigzag does not move price deep enough. To achieve this purpose cycle wave y may be expected to move reasonably below the end of cycle wave w at 26.06. The target calculated would see this expectation met.
Cycle wave y is expected to subdivide as a zigzag, which subdivides 5-3-5.
Cycle wave w lasted 7.6 years and cycle wave x lasted 2.7 years. Cycle wave y may be expected to last possibly about a Fibonacci 5 or 8 years.
If it continues higher, then primary wave B may not move beyond the start of primary wave A above 76.90.
WEEKLY CHART
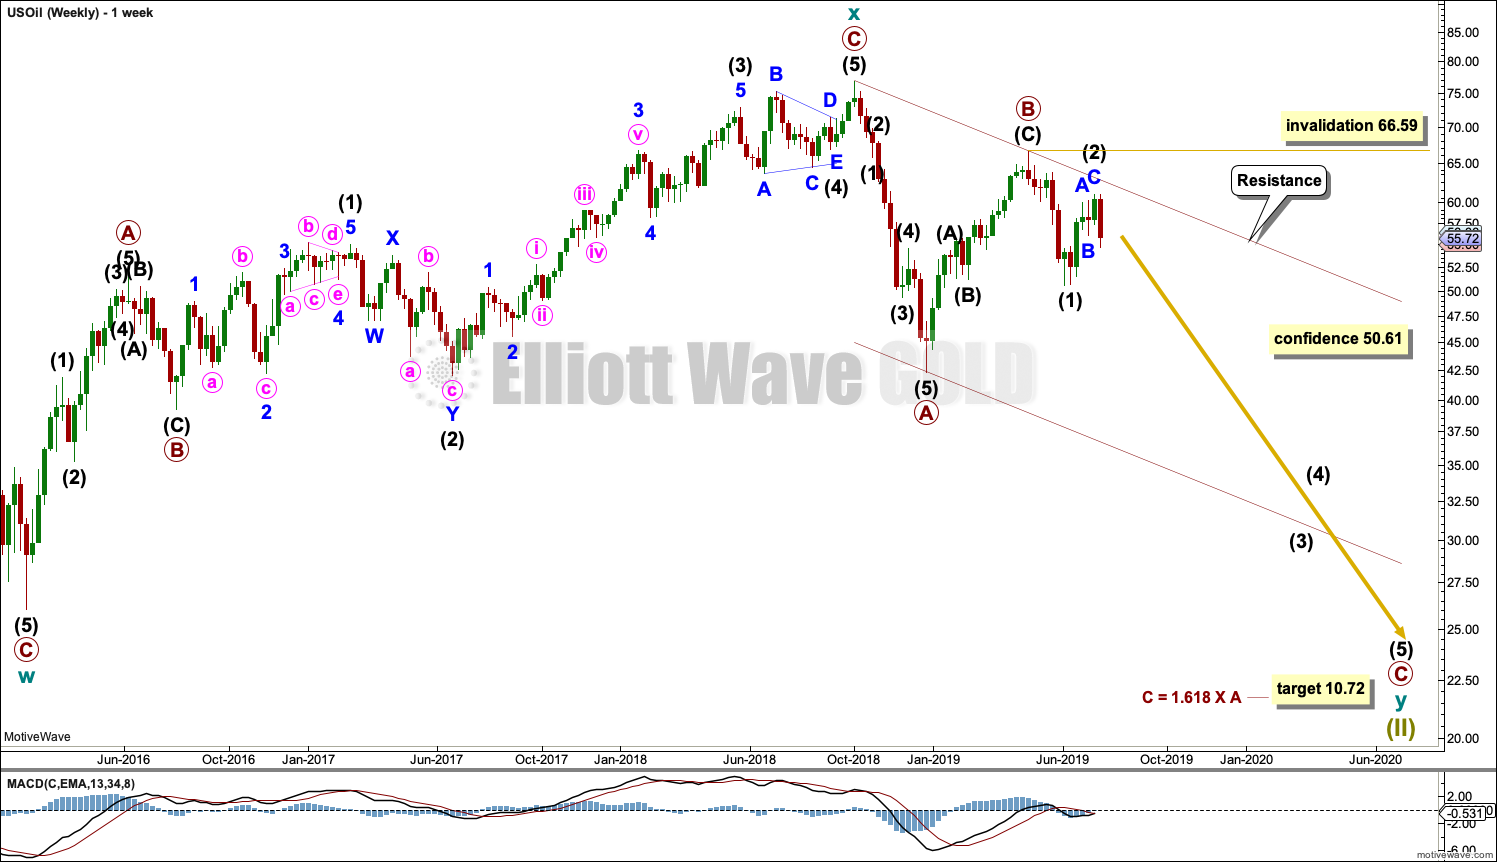
Click chart to enlarge.
This weekly chart shows all of cycle waves x and y so far.
Cycle wave y is expected to subdivide as a zigzag. A zigzag subdivides 5-3-5. Primary wave A must subdivide as a five wave structure if this wave count is correct.
Primary wave A may be a complete five wave impulse at the last low.
Primary wave B may now be a complete single zigzag at the last high.
Primary wave C may have just begun. Primary wave C must subdivide as a five wave structure.
Primary wave A lasted 12 weeks, just one short of a Fibonacci 13.
Primary wave C may be longer in time as well as price. If cycle wave y lasts a Fibonacci 5 years, then primary wave C within it may take as long as a Fibonacci 233 weeks.
Intermediate wave (1) within primary wave C may be a complete impulse. Intermediate wave (2) may not move beyond the start of intermediate wave (1) above 66.59.
Draw a channel about the zigzag of primary wave y using Elliott’s technique for a correction. Draw the first trend line from the start of primary wave A to the end of primary wave B, then place a parallel copy on the end of primary wave A. The upper edge of this channel may show where bounces along the way down find resistance. The lower edge of the channel may provide support.
DAILY CHART
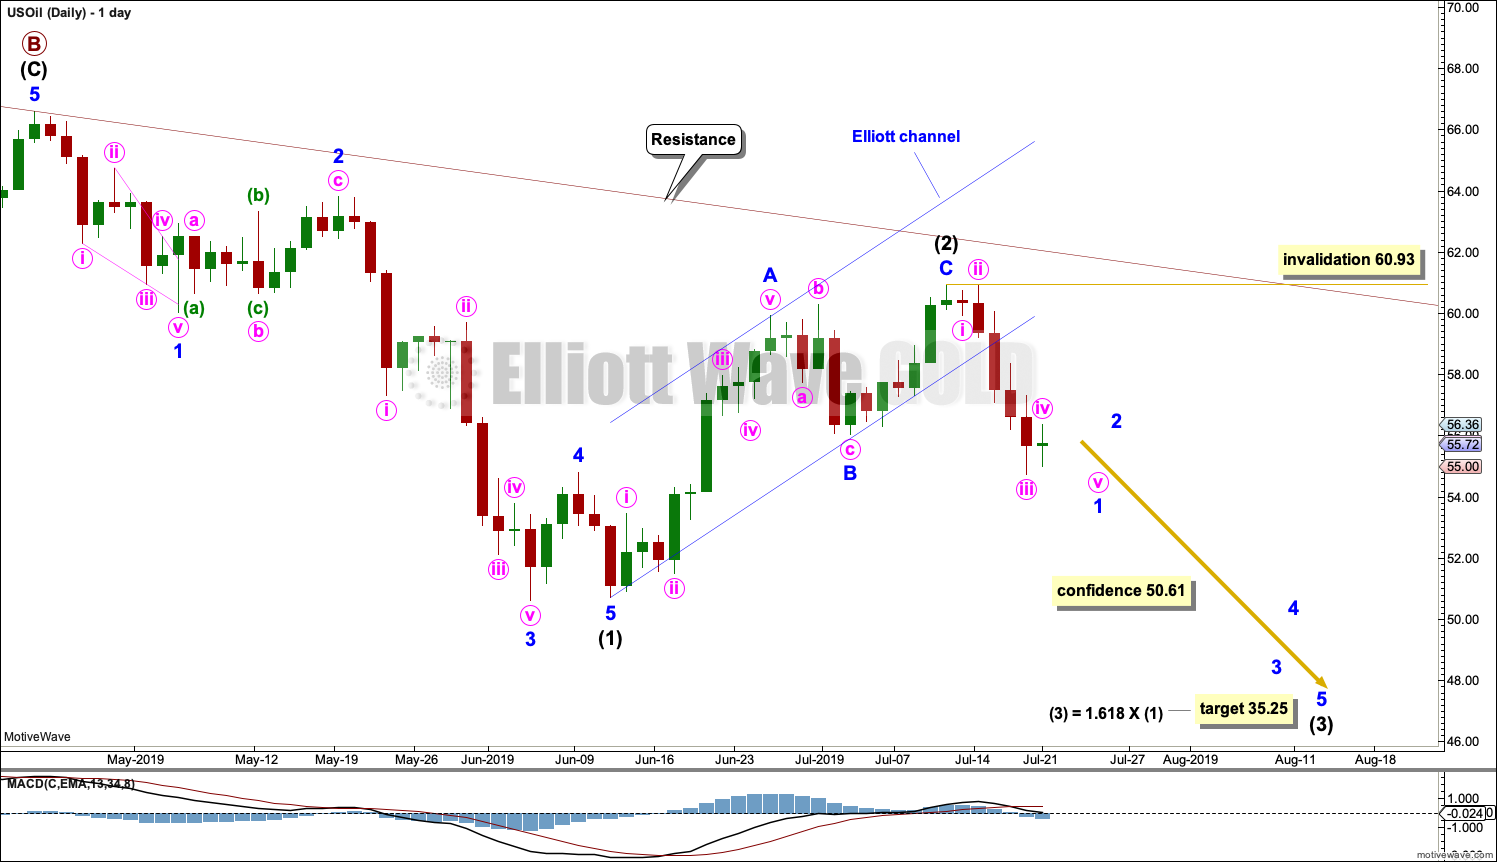
Click chart to enlarge.
Note that monthly and weekly charts are on a semi-log scale, but this daily chart is on an arithmetic scale. This makes a slight difference to trend channels.
It is possible that intermediate wave (1) is complete. Minor wave 4 for this wave count exhibits some alternation to minor wave 2; minor wave 2 may be a relatively deep zigzag or flat, and minor wave 4 may be a more shallow zigzag.
Minor wave 5 ends with a slight 0.11 truncation.
Intermediate wave (2) may also now be complete as a zigzag.
Intermediate wave (3) may only subdivide as an impulse, and it must move below the end of intermediate wave (1). Within intermediate wave (3), minor wave 1 may be nearing completion; it may end early next week. Thereafter, minor wave 2 may be a small bounce that may not move beyond the start of minor wave 1 above 60.93.
ALTERNATE ELLIOTT WAVE COUNT
MONTHLY CHART
Click chart to enlarge.
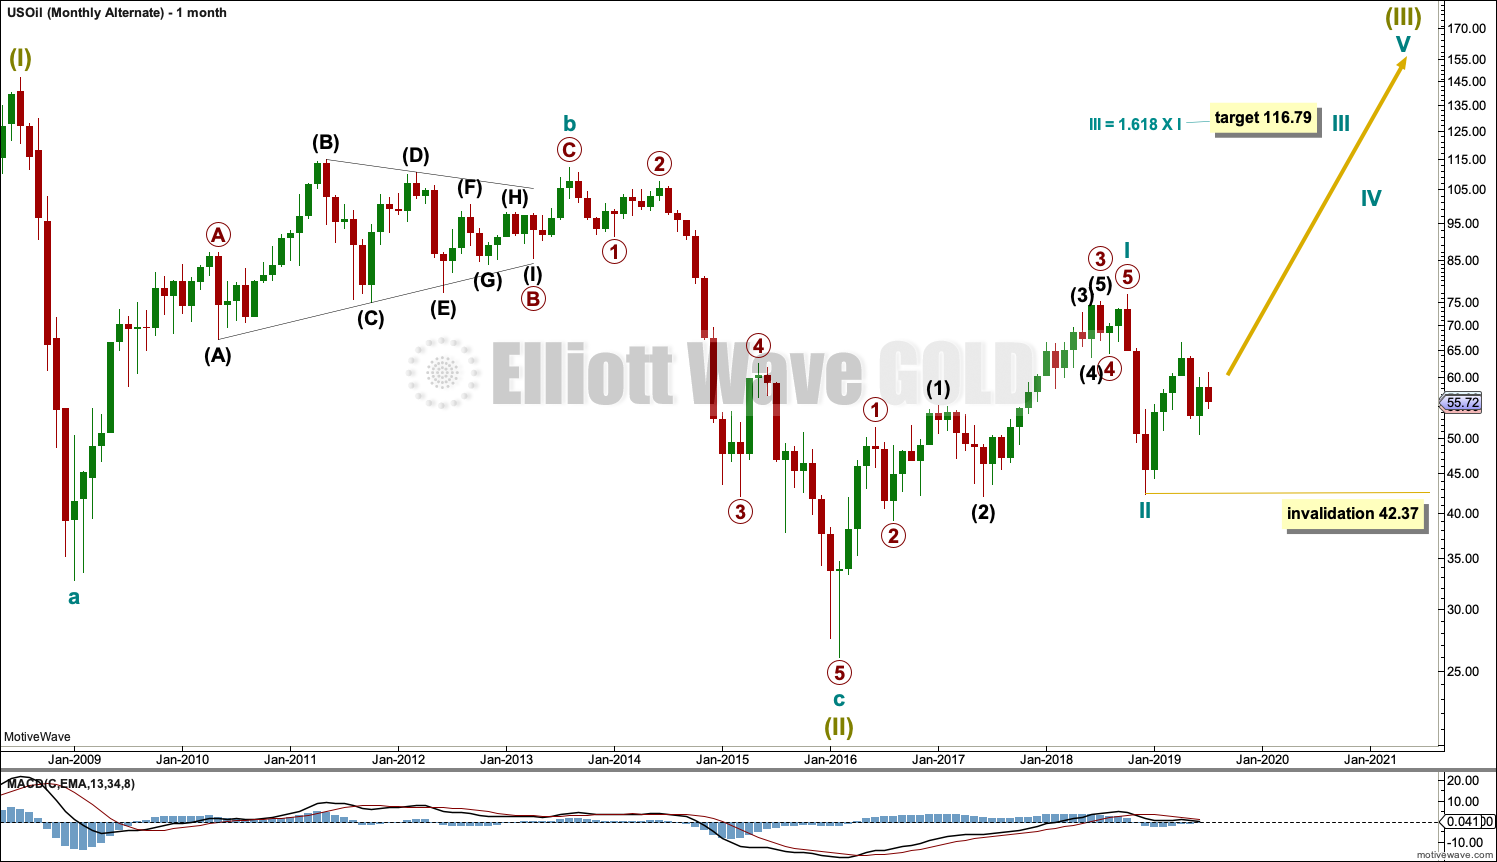
It is possible that the bear market is over for Oil and a new bull market has begun.
For a bullish wave count for Oil, the upwards wave from the major low at 26.06 in February 2016 must be seen as a complete five wave impulse. This is labelled cycle wave I.
Cycle wave II may be a complete zigzag at 0.679 the depth of cycle wave I.
A target is calculated for cycle wave III to reach a common Fibonacci ratio to cycle wave I.
Within cycle wave III, no second wave correction may move beyond the start of its first wave below 42.37.
WEEKLY CHART
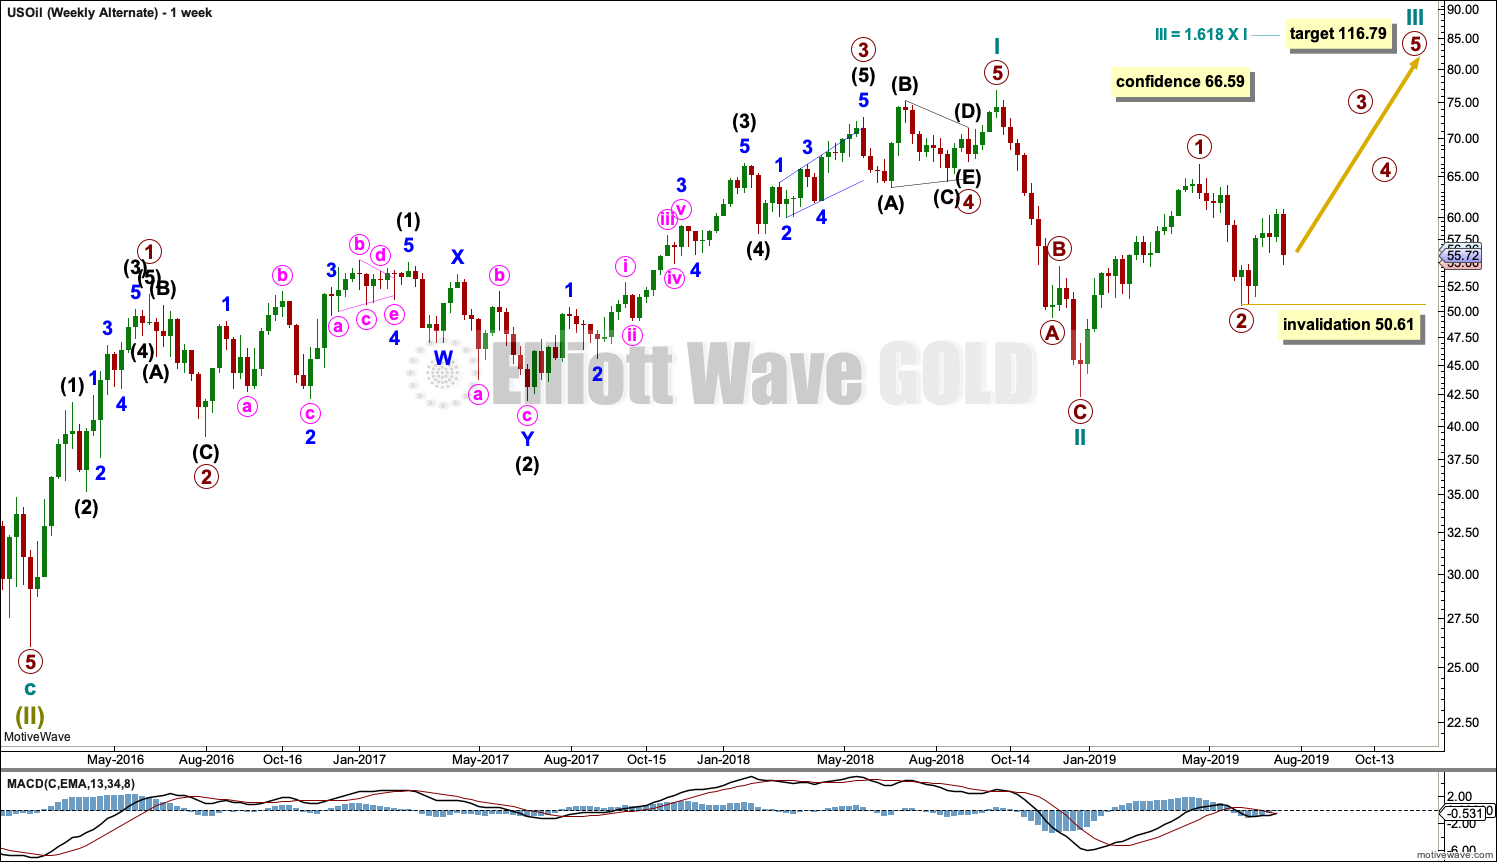
Click chart to enlarge.
This weekly chart shows detail of cycle wave I as a five wave impulse.
Cycle wave II does look best as a three. This is the only part of this wave count that has a better look than the main wave count, which sees this downwards wave as a five.
Cycle wave III may only subdivide as an impulse. Within cycle wave III, so far primary waves 1 and 2 may be complete.
DAILY CHART
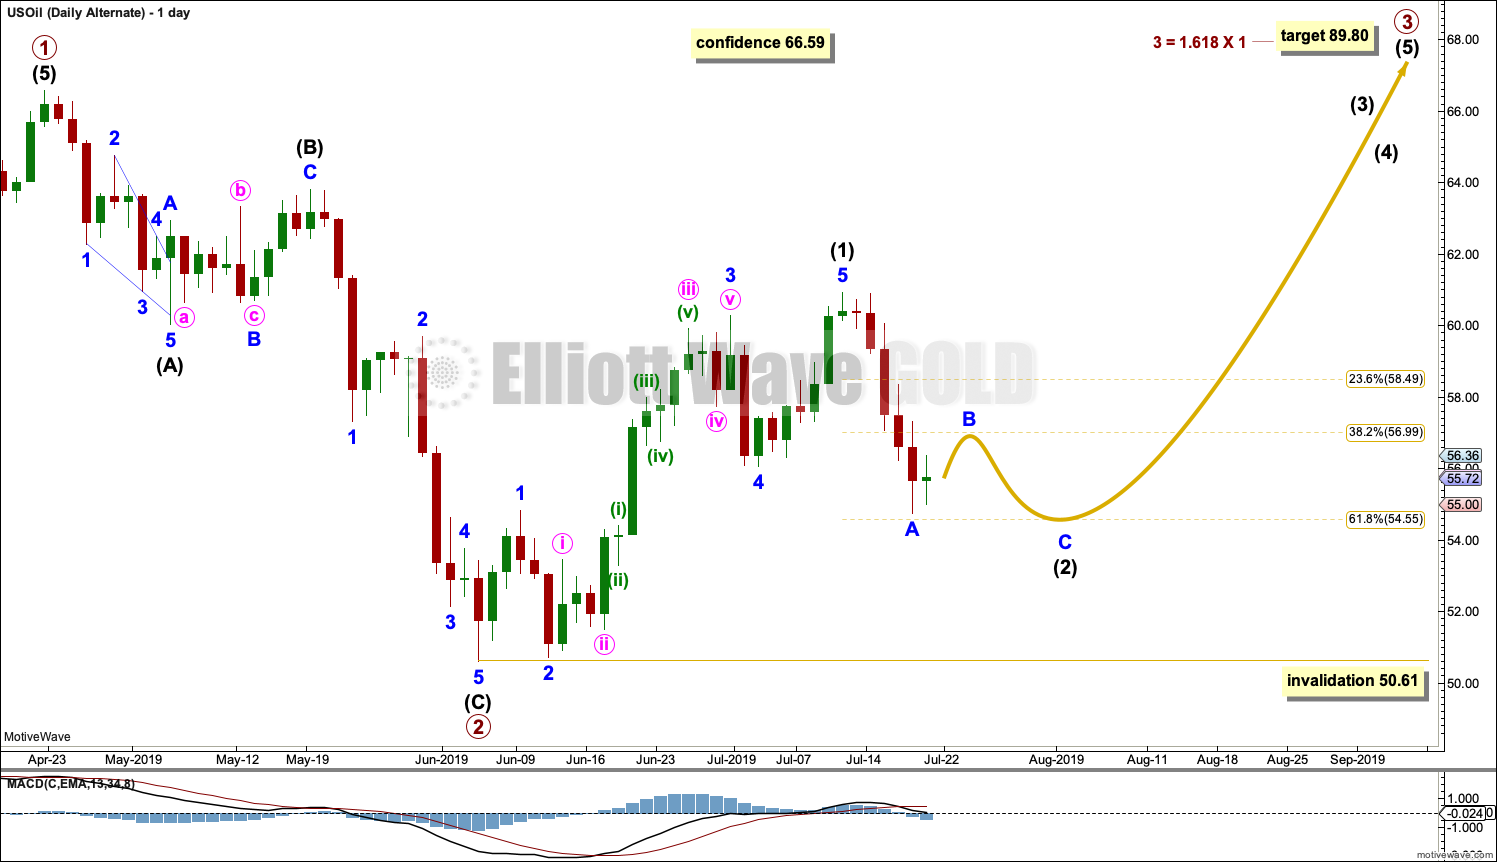
Click chart to enlarge.
Primary wave 3 may only subdivide as an impulse. Within the impulse, intermediate wave (1) may be complete.
Intermediate wave (2) may now be moving lower as a zigzag. It may end close to the 0.618 Fibonacci ratio of intermediate wave (1).
Intermediate wave (2) may not move beyond the start of intermediate wave (1) below 50.61.
TECHNICAL ANALYSIS
MONTHLY CHART
Click chart to enlarge. Chart courtesy of StockCharts.com.
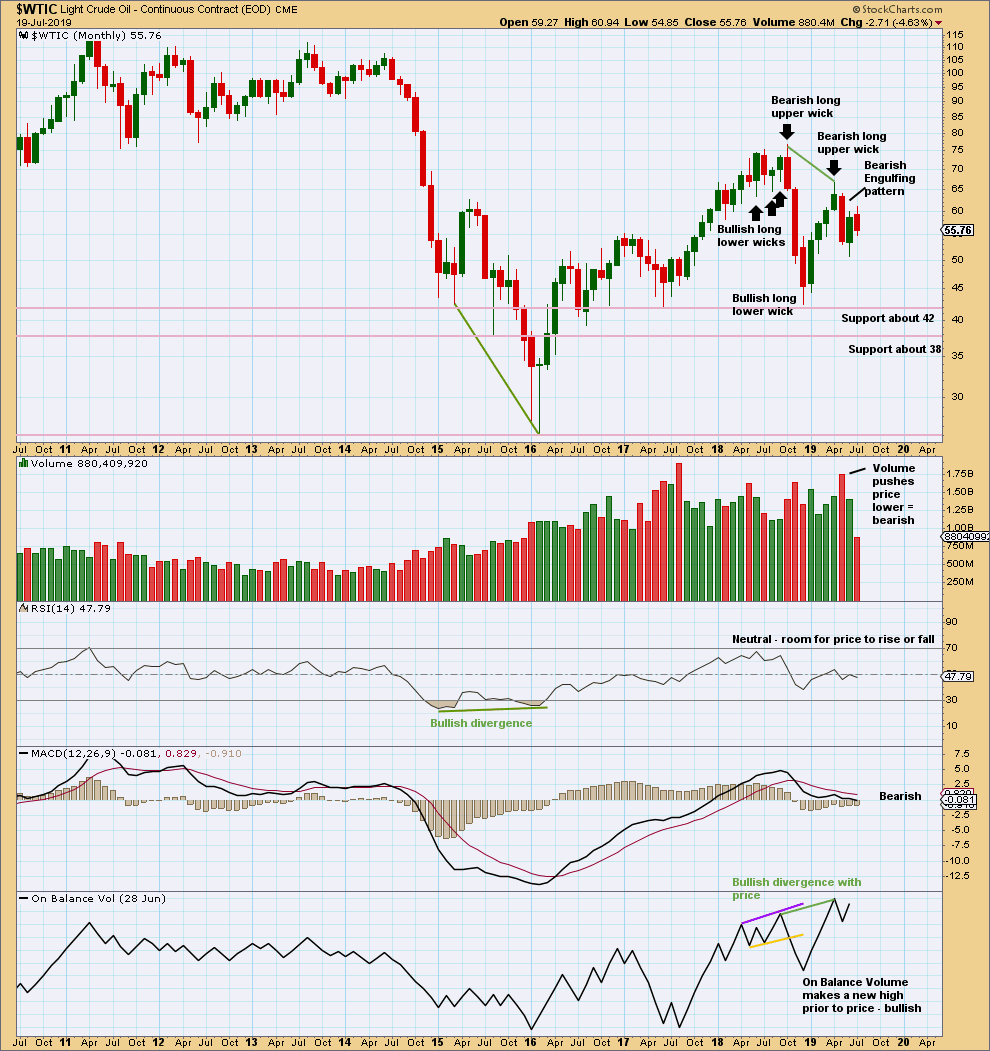
May has closed with a strong Bearish Engulfing candlestick pattern, which has strong support from volume. This supports the main Elliott wave count.
June moved price lower with a lower low and a lower high, but the candlestick closed green and the balance of volume was upwards. Upwards movement within the month did not have support from volume. This also supports the main Elliott wave count.
Bullish divergence between price and On Balance Volume supports the alternate Elliott wave count.
WEEKLY CHART
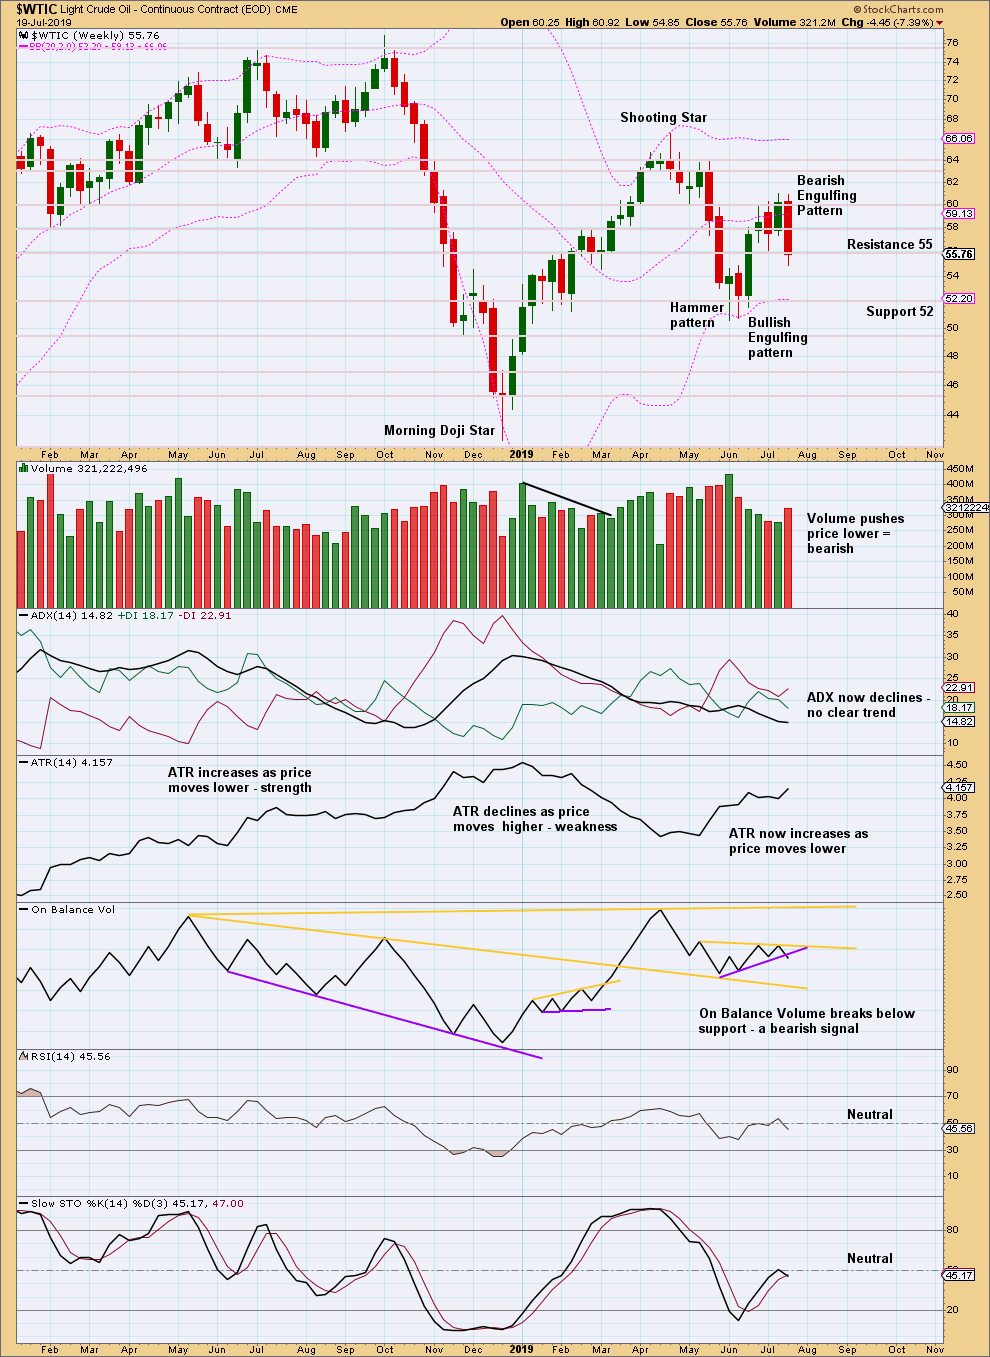
Click chart to enlarge. Chart courtesy of StockCharts.com.
This week a strong bearish candlestick reversal pattern after a bounce of five weeks has good support from volume and a bearish signal from On Balance Volume. This fairly strongly supports the main Elliott wave count.
DAILY CHART
Click chart to enlarge. Chart courtesy of StockCharts.com.
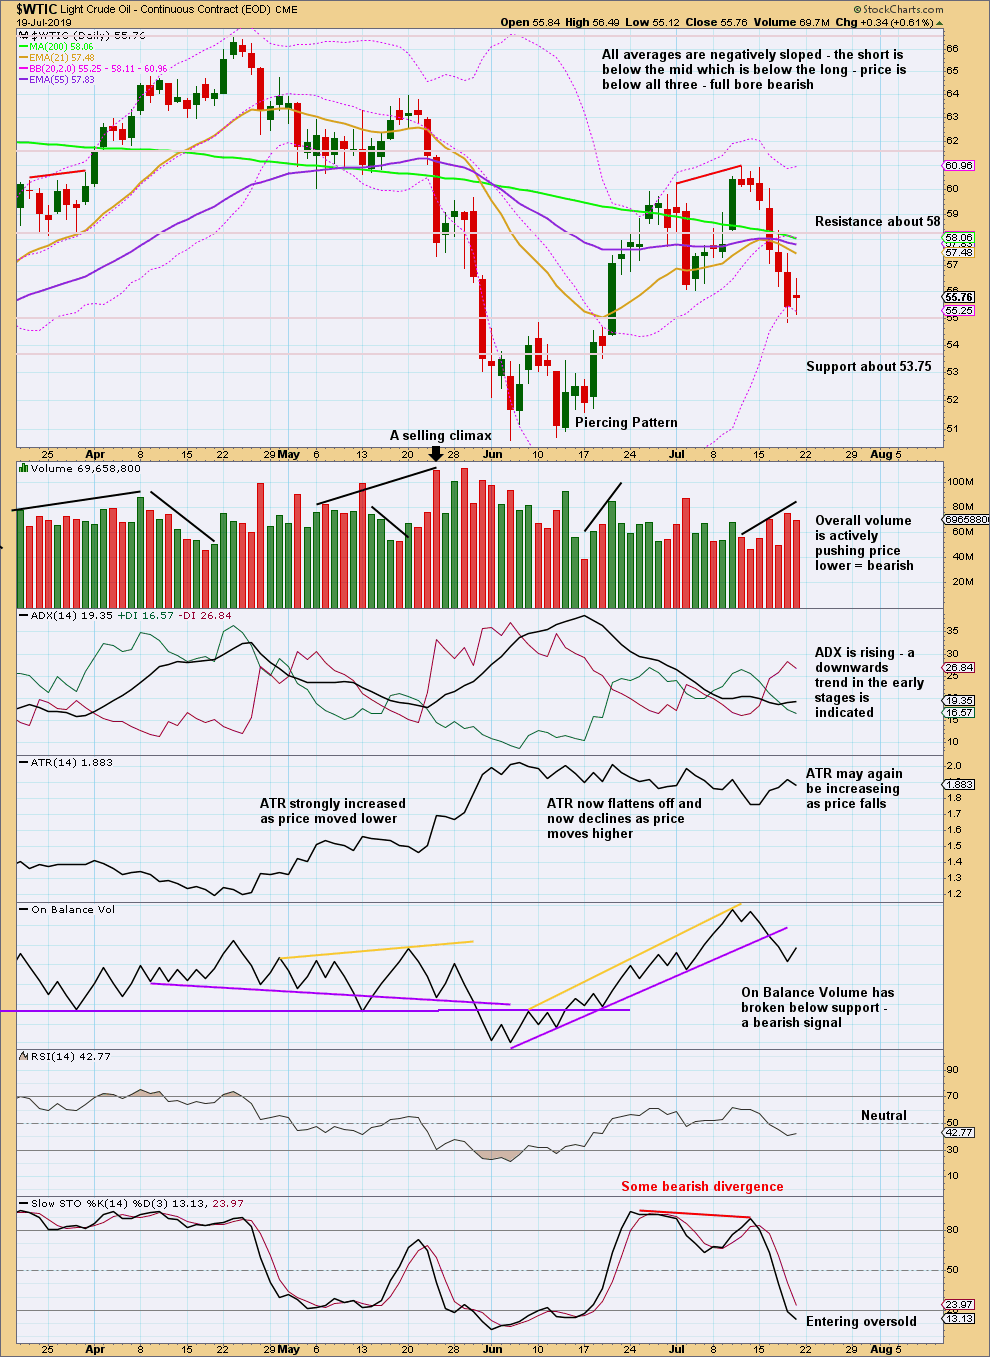
The bounce ended without a candlestick reversal pattern at the high.
Downwards movement has support from volume pushing price lower, a bearish signal from On Balance Volume, and possibly some increase in ATR. This supports the main Elliott wave count.
—
Always practice good risk management as the most important aspect of trading. Always trade with stops and invest only 1-5% of equity on any one trade. Failure to manage risk is the most common mistake new traders make.
Hi Lara
It appears the Oil finished its correction of wave 2 and we are now starting wave 3, wanted to get your thoughts?
Best regards
Baron
I would say it is still minor 1 finishing, then we’ll have minor 2 up.
I agree with that assessment.
Oil today moved strongly lower and has strong push down from volume.
That doesn’t look like a B wave within a second wave bounce, that looks like the second wave correction is over and so a third wave down looks likely now to be underway.
Hi Lara,
Could yesterdays movement have been minute (v) of minor 1?
No, it looks way too big. This looks like a new wave, minor 1 looks complete.
Lara
Any midweek advice on direction of S&P? Very positive day today, closed on its high and looking more bullish on the chart as it bounced off the bottom of the channel.
Thanks
Rich
Yes. The main (bearish for short to mid term) wave count is invalidated with a new all time high.
Confidence in the alternate may now be had.
The Bearish Engulfing candlestick pattern failed to indicate a trend change. The trend remains up. Use targets on the alternate daily chart, the channel also may be used to indicate support for pullbacks along the way up.