
Lara’s Weekly: Elliott Wave and Technical Analysis of S&P500 and Gold and US Oil | Charts – January 3, 2020

S&P 500
At this stage, specific short-term price points are used to indicate when minor wave 4 may have arrived.
Summary: At this stage, it is possible that minor wave 3 could be over. Confidence in this view is required with a new low below 3,212.03.
If price continues higher, then the next target would be at 3,289.
Three large pullbacks or consolidations (fourth waves) during the next 1-2 years are expected: for minor wave 4 (coming soon, possibly tomorrow), then intermediate (4), and then primary 4. Extreme conditions warrant more careful attention to risk management at this time.
The biggest picture, Grand Super Cycle analysis, is here.
Monthly charts were last published here. There are two further alternate monthly charts here.
ELLIOTT WAVE COUNTS
The two weekly Elliott wave counts below will be labelled First and Second. They may be about of even probability. When the fifth wave currently unfolding on weekly charts may be complete, then these two wave counts will diverge on the severity of the expected following bear market. To see an illustration of this future divergence monthly charts should be viewed.
FIRST WAVE COUNT
WEEKLY CHART
Click chart to enlarge.
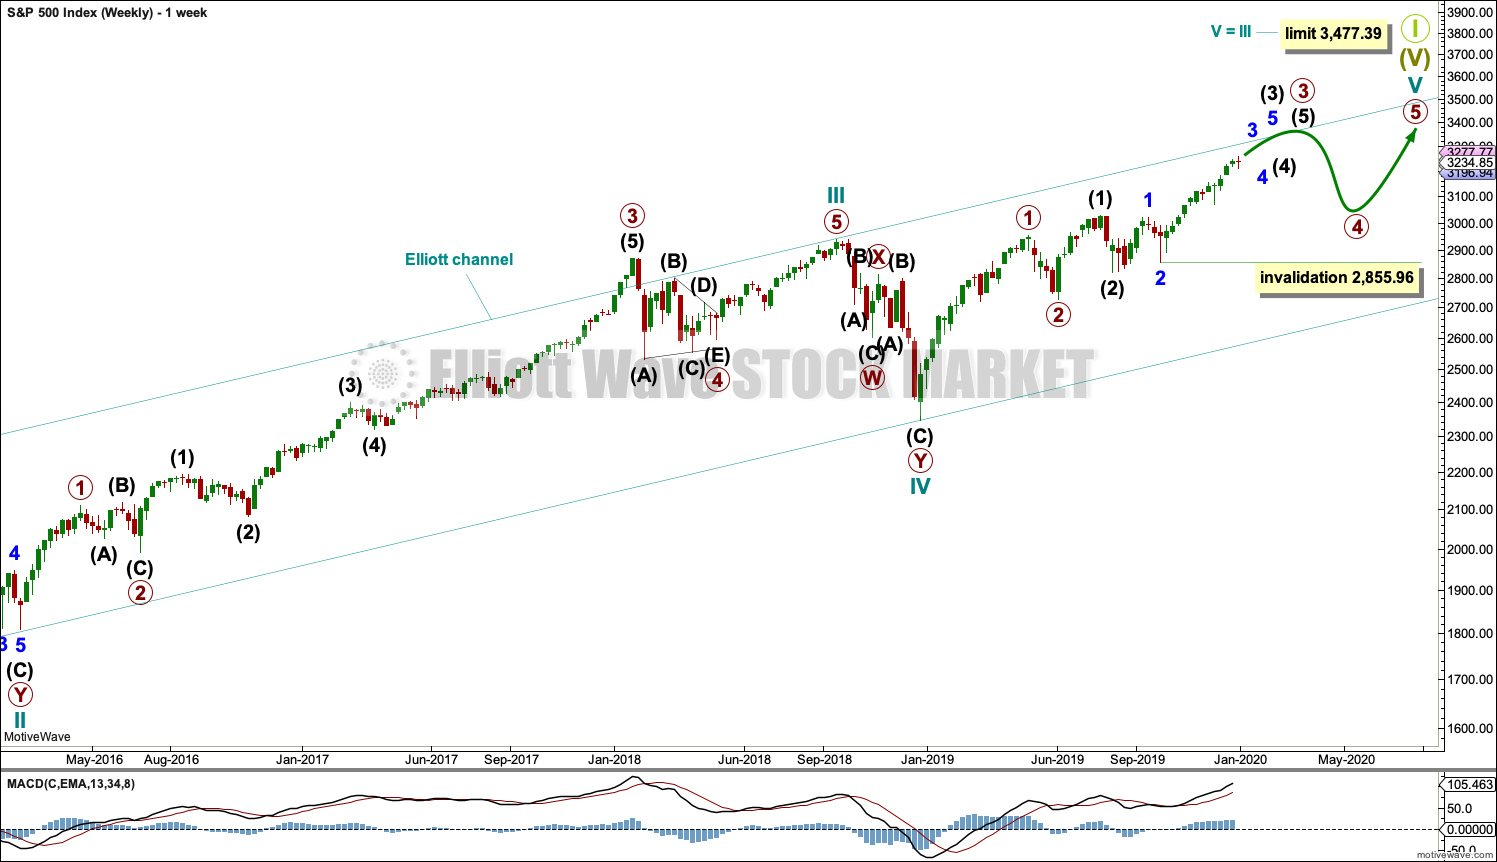
The basic Elliott wave structure consists of a five wave structure up followed by a three wave structure down (for a bull market). This wave count sees the bull market beginning in March 2009 as an incomplete five wave impulse and now within the last fifth wave, which is labelled cycle wave V. This impulse is best viewed on monthly charts. The weekly chart focusses on the end of it.
Elliott wave is fractal. This fifth wave labelled cycle wave V may end a larger fifth wave labelled Super Cycle wave (V), which may end a larger first wave labelled Grand Super Cycle wave I.
The teal Elliott channel is drawn using Elliott’s first technique about the impulse of Super Cycle wave (V). Draw the first trend line from the end of cycle wave I (off to the left of the chart, the weekly candlestick beginning 30th November 2014) to the end of cycle wave III, then place a parallel copy on the end of cycle wave II. This channel perfectly shows where cycle wave IV ended at support. The strongest portion of cycle wave III, the end of primary wave 3, overshoots the upper edge of the channel. This is a typical look for a third wave and suggests the channel is drawn correctly and the way the impulse is counted is correct.
Within Super Cycle wave (V), cycle wave III is shorter than cycle wave I. A core Elliott wave rule states that a third wave may never be the shortest. For this rule to be met in this instance, cycle wave V may not be longer in length than cycle wave III. This limit is at 3,477.39.
Cycle wave V may subdivide either as an impulse or an ending diagonal. Impulses are much more common. An alternative wave count which considered an ending diagonal has been invalidated. While it is possible a diagonal may become an alternate wave count in coming weeks or months, at this stage the structure does not fit.
At this stage, cycle wave V may take another one to two or so years to complete.
The daily chart below will focus on movement from the end of intermediate wave (2) within primary wave 3.
In historic analysis, two further monthly charts have been published that do not have a limit to upwards movement and are more bullish than this wave count. Members are encouraged to consider those possibilities (links below summary) alongside the wave counts presented on a daily and weekly basis. It is my judgement that the two weekly wave counts published in this analysis have the highest probability, so they shall be the only wave counts published on a daily basis.
Within cycle wave V, primary waves 1 and 2 may be complete. Within primary wave 3, intermediate waves (1) and (2) may be complete. Within the middle of intermediate wave (3), no second wave correction may move beyond its start below 2,855.96.
DAILY CHART

Click chart to enlarge.
All of primary wave 3, intermediate wave (3) and minor wave 3 may only subdivide as impulses.
Minor wave 3 has passed 1.618 the length of minor wave 1, and within it minute wave v has passed equality in length with minute wave i. The next target may be now about 3,289 where minuette wave (v) within minute wave v would reach 1.618 the length of minuette wave (i).
Minor wave 2 was a sharp deep pullback, so minor wave 4 may be expected to be a very shallow sideways consolidation to exhibit alternation. Minor wave 2 lasted 2 weeks. Minor wave 4 may be about the same duration, or it may be a longer lasting consolidation. Minor wave 4 may end within the price territory of the fourth wave of one lesser degree; minute wave iv has its range from 3,154.26 to 3,070.49.
Minor wave 4 may not move into minor wave 1 price territory below 3,021.99.
Intermediate wave (3) has now moved far enough above the end of intermediate wave (1) to allow intermediate wave (4) to unfold and remain above intermediate wave (1) price territory.
Draw an acceleration channel now about intermediate wave (3): draw the first trend line from the end of minor wave 1 to the last high, then place a parallel copy on the end of minor wave 2. Keep redrawing the channel as price makes new highs. Minor wave 4 may find support at the lower edge of this channel if it is long lasting or deep enough.
Price is approaching the upper edge of the wide teal channel copied over from monthly and weekly charts. If price gets up to this trend line, then a reaction downwards there would be highly likely.
SECOND WAVE COUNT
WEEKLY CHART
Click chart to enlarge.
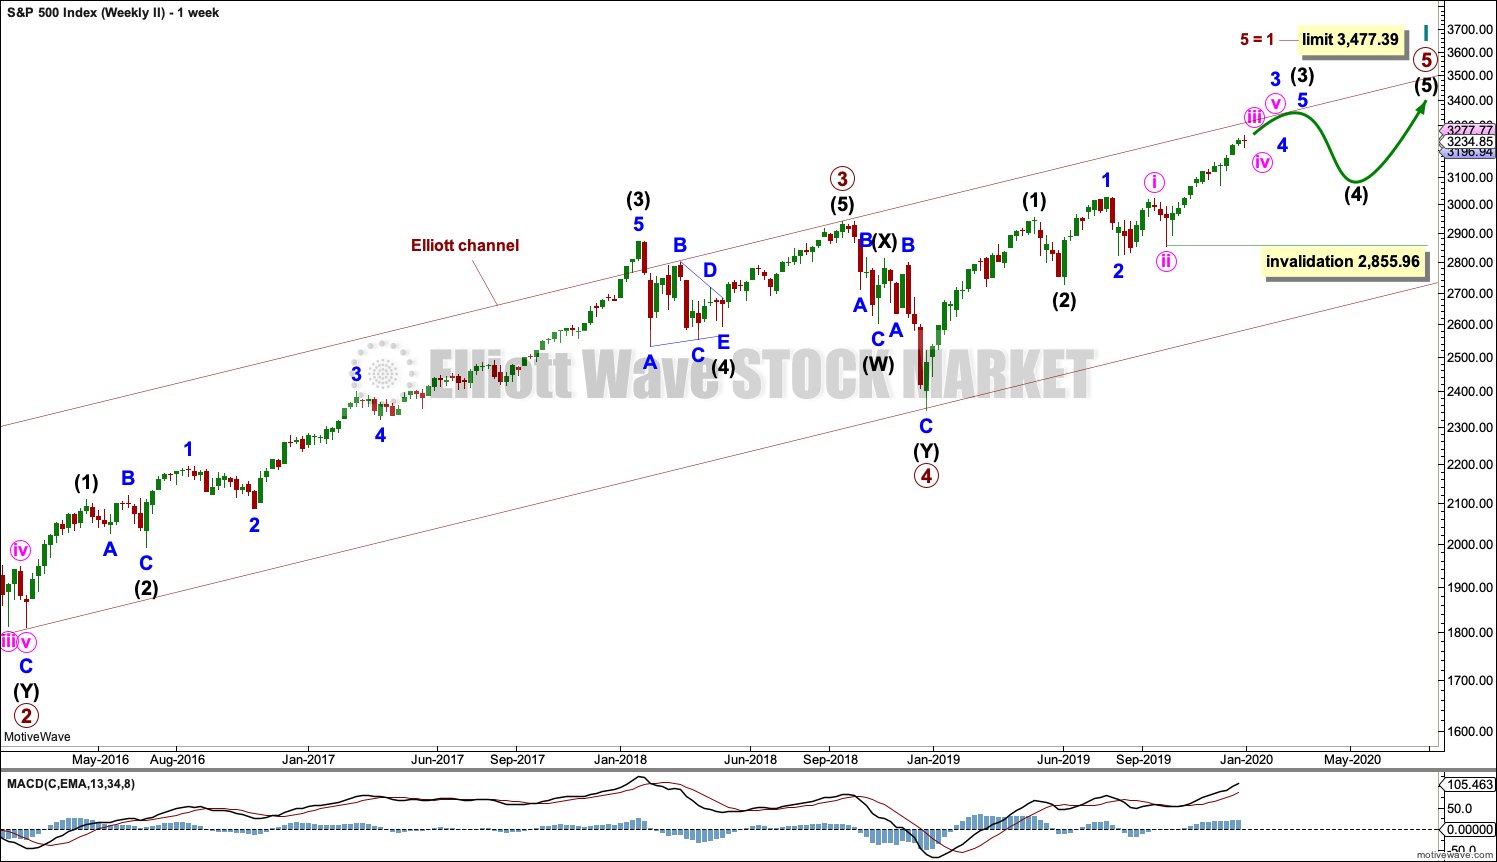
This weekly chart is almost identical to the first weekly chart, with the sole exception being the degree of labelling.
This weekly chart moves the degree of labelling for the impulse beginning in March 2009 all down one degree. This difference is best viewed on monthly charts.
The impulse is still viewed as nearing an end; a fifth wave is still seen as needing to complete higher. This wave count labels it primary wave 5. Primary wave 5 may still need another year to two or so to complete, depending upon how time consuming the corrections within it may be.
Primary wave 5 may be subdividing as an impulse, in the same way that cycle wave V is seen for the first weekly chart.
TECHNICAL ANALYSIS
MONTHLY CHART
Click chart to enlarge. Chart courtesy of StockCharts.com.
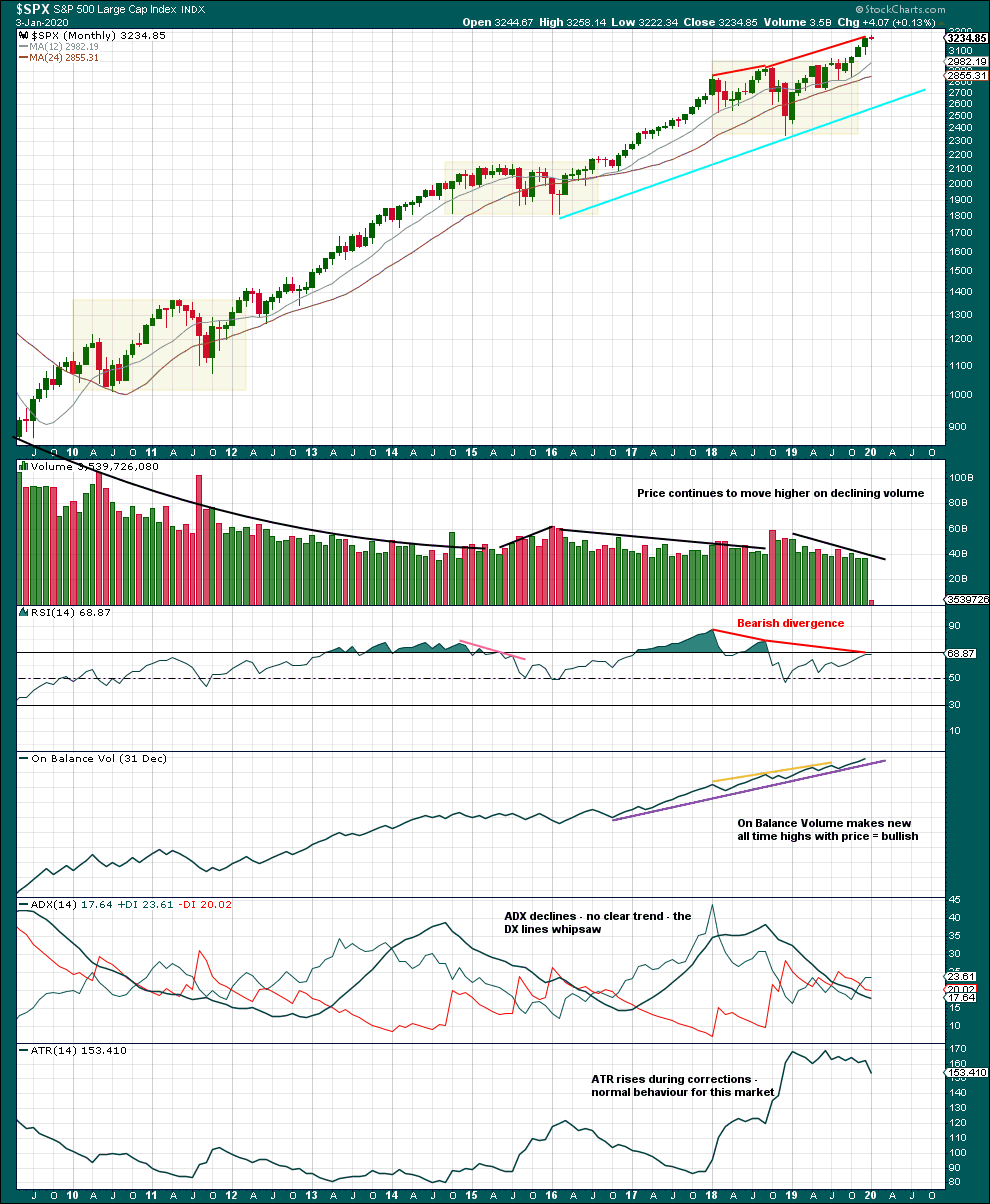
There are three large consolidations noted on this chart, in shaded areas. After a breakout from a multi-month consolidation, it is reasonable to expect a multi month bullish move may result.
Note that in each of the first two cases a pullback saw price re-enter the consolidation zone after the breakout, before price then moved up and away. It is possible that may happen again after the last breakout from a consolidation.
This chart very clearly exhibits rising price on declining volume has now persisted for several years. A decline in volume last month, in current market conditions, is not of concern.
On Balance Volume supports the Elliott wave count.
WEEKLY CHART
Click chart to enlarge. Chart courtesy of StockCharts.com.
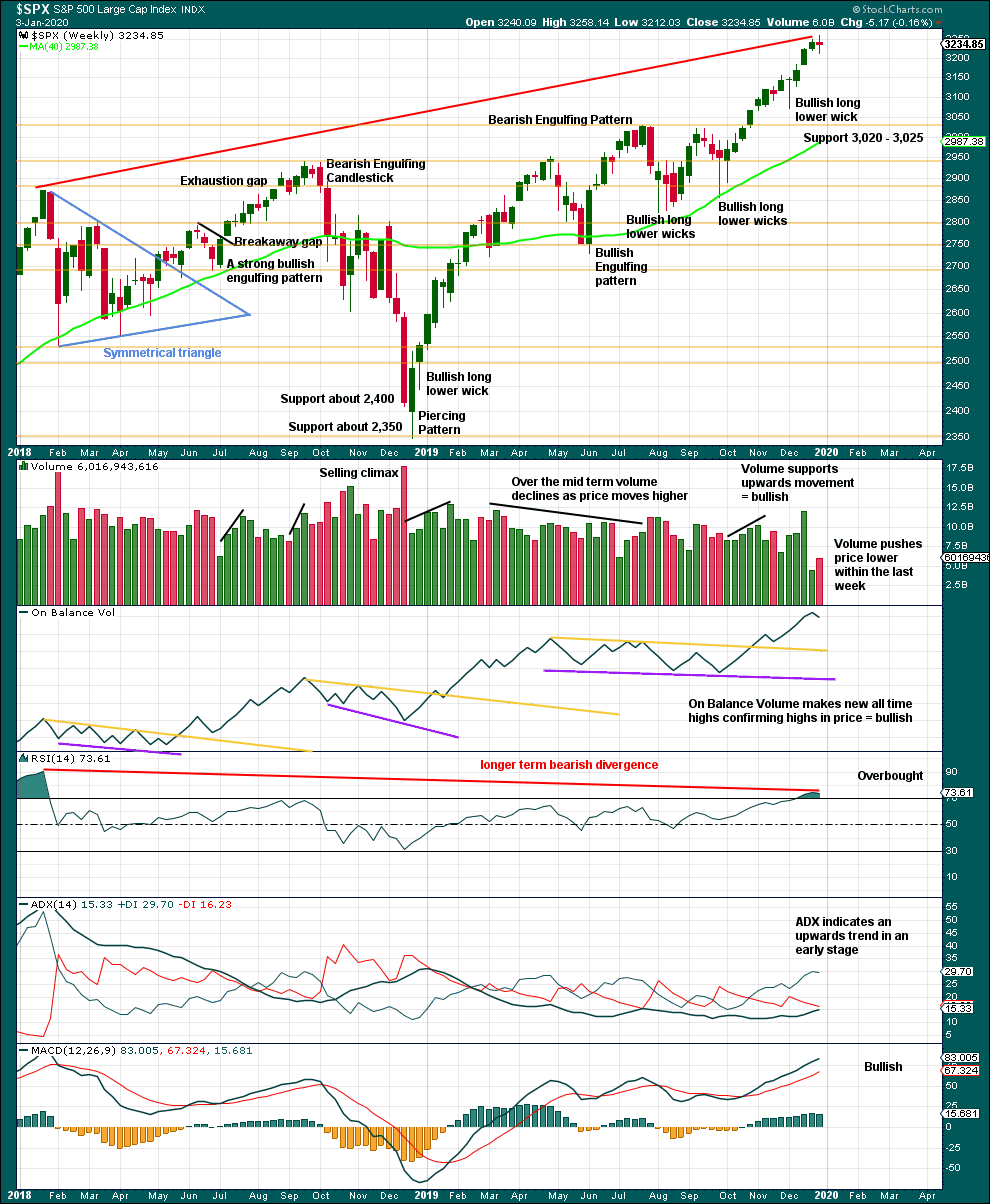
It is very clear that the S&P is in an upwards trend and the bull market is continuing. Price does not move in straight lines; there will be pullbacks and consolidations along the way.
This chart is overall bullish. There are no signs of weakness in upwards movement.
RSI is now overbought. That does not mean upwards movement must end here, because it can continue for several weeks while RSI reaches more extreme. RSI reaching overbought is a warning that conditions are now becoming extreme. A pullback or consolidation will follow and the longer conditions are extreme the closer this will be. However, assume the trend remains the same until proven otherwise. This warning should be heeded by careful attention to risk management.
The doji this week on its own is not a reversal signal. It is a sign of a small pause.
DAILY CHART
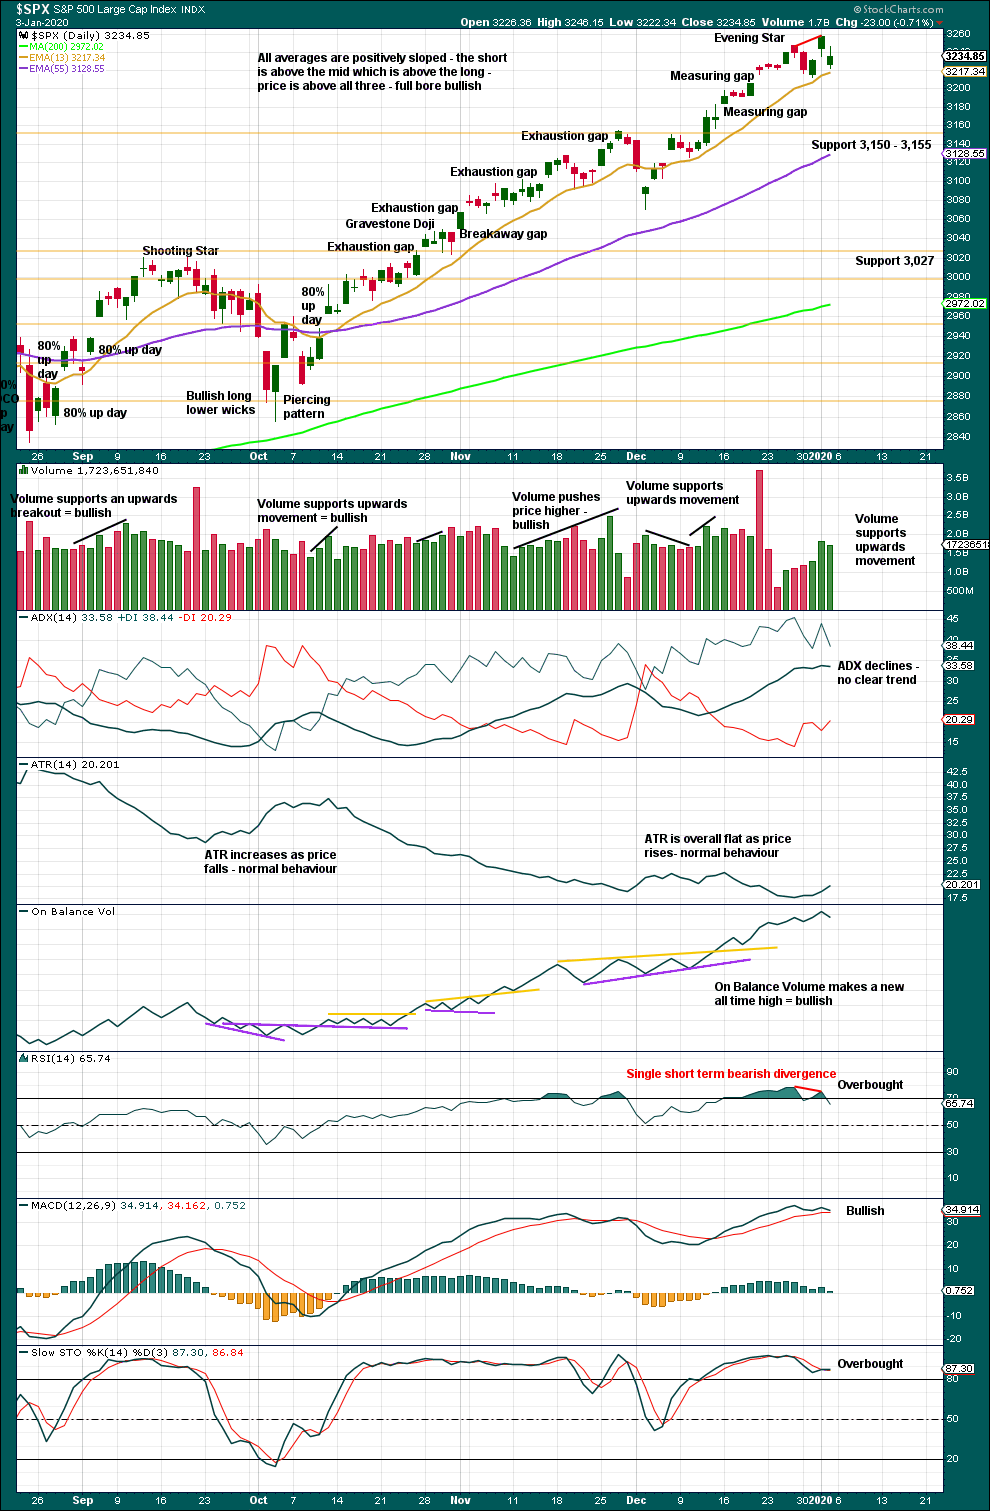
Click chart to enlarge. Chart courtesy of StockCharts.com.
There is an upwards trend in place. There will be corrections along the way.
Like the weekly chart, this chart is bullish.
RSI now exhibits bearish divergence while overbought. This is often (not always) a warning of a pullback or consolidation to develop.
BREADTH – AD LINE
WEEKLY CHART
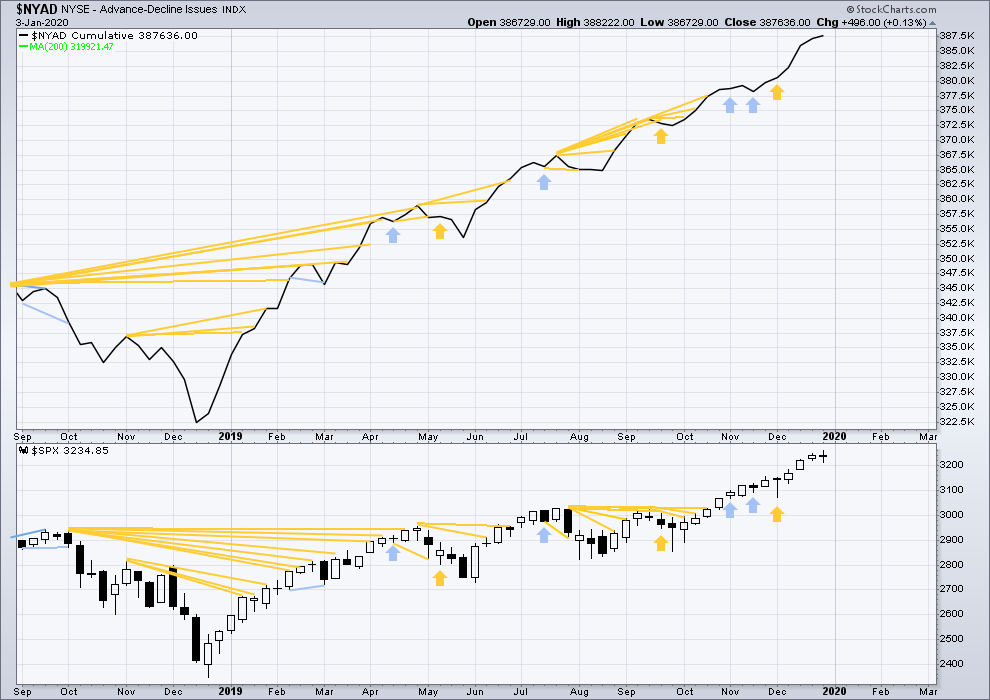
Click chart to enlarge. Chart courtesy of StockCharts.com. So that colour blind members are included, bearish signals will be noted with blue and bullish signals with yellow.
Bear markets from the Great Depression and onwards have been preceded by an average minimum of 4 months divergence between price and the AD line with only two exceptions in 1946 and 1976. With the AD line making new all time highs last week, the end of this bull market and the start of a new bear market is very likely a minimum of 4 months away, which is the beginning of May 2020.
In all bear markets in the last 90 years there is some positive correlation (0.6022) between the length of bearish divergence and the depth of the following bear market. No to little divergence is correlated with more shallow bear markets. Longer divergence is correlated with deeper bear markets.
If a bear market does develop here, it comes after no bearish divergence. It would therefore more likely be shallow.
All of small, mid and large caps have made new swing highs above the prior swing high on the 13th of September, and mid caps have now made new all time highs. This upwards movement appears to be mostly driven by large caps, which is a feature of aged bull markets. This bull market at over 10 years duration certainly fits the definition of aged.
Again both price and the AD line have made new all time highs. There is no divergence. Upwards movement has support from rising market breadth.
Large caps all time high: 3,258.14 on 2nd January 2020.
Mid caps all time high: 2,073.72 on 2nd January 2020.
Small caps all time high: 1,100.58 on 27th August 2018.
DAILY CHART
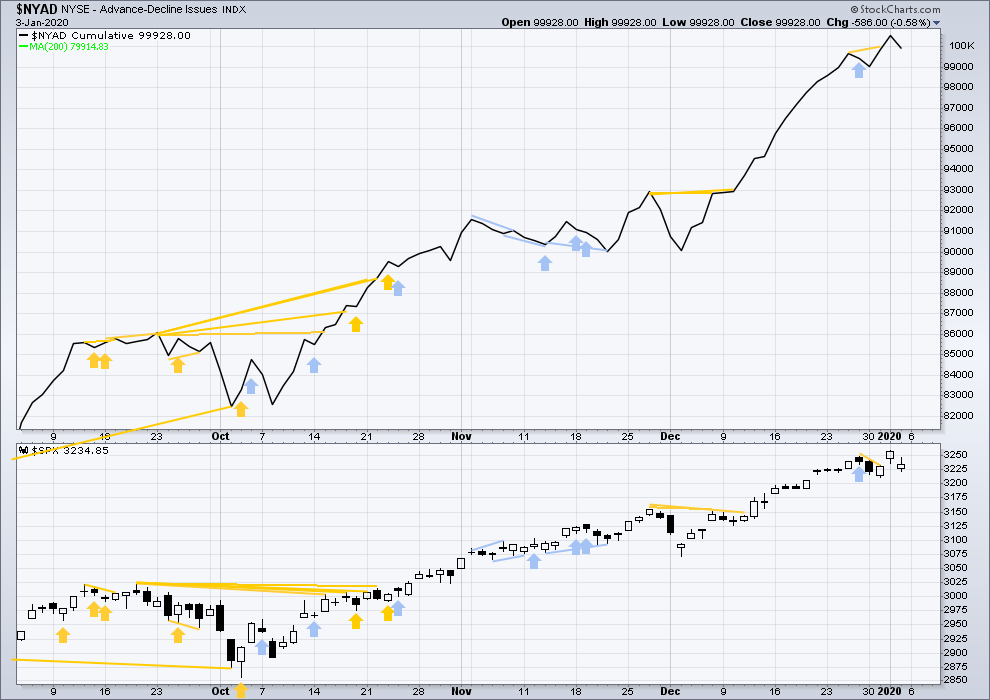
Click chart to enlarge. Chart courtesy of StockCharts.com. So that colour blind members are included, bearish signals will be noted with blue and bullish signals with yellow.
Breadth should be read as a leading indicator.
Downwards movement on Friday comes with a normal corresponding decline in breadth. There is no new short-term divergence.
VOLATILITY – INVERTED VIX CHART
WEEKLY CHART
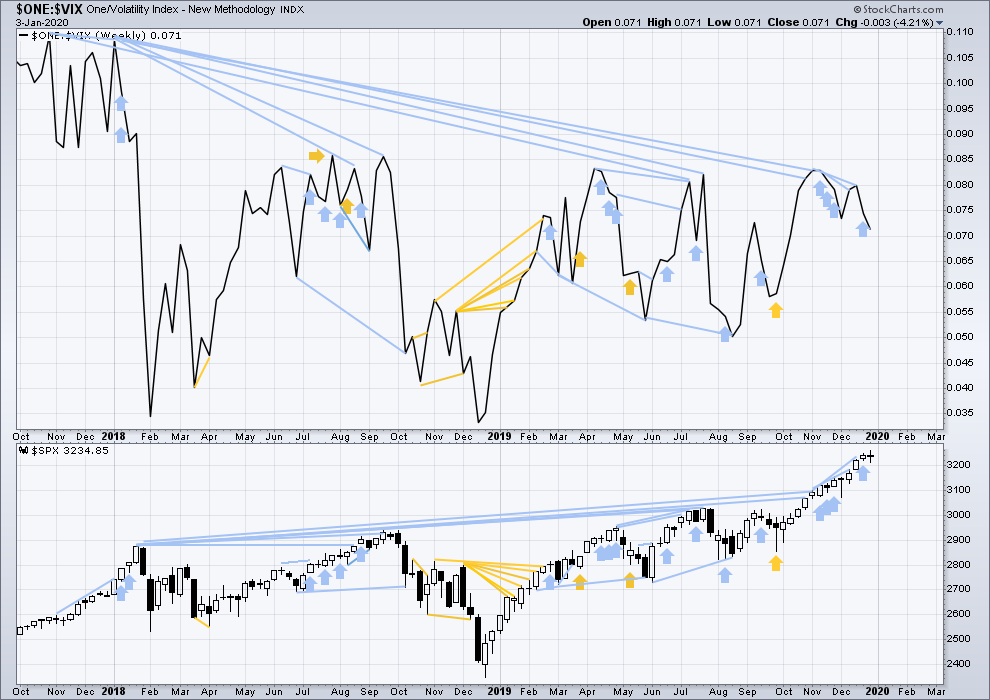
Click chart to enlarge. Chart courtesy of StockCharts.com. So that colour blind members are included, bearish signals will be noted with blue and bullish signals with yellow.
The all time high for inverted VIX was on 30th October 2017. There is now over two years of bearish divergence between price and inverted VIX.
The rise in price is not coming with a normal corresponding decline in VIX; VIX remains elevated. This long-term divergence is bearish and may yet develop further as the bull market matures.
This divergence may be an early warning, a part of the process of a top developing that may take years. It may is clearly not useful in timing a trend change from bull to a fully fledged bear market.
This week completes an outside week. Inverted VIX has declined during the week. There is no new short-term divergence.
DAILY CHART
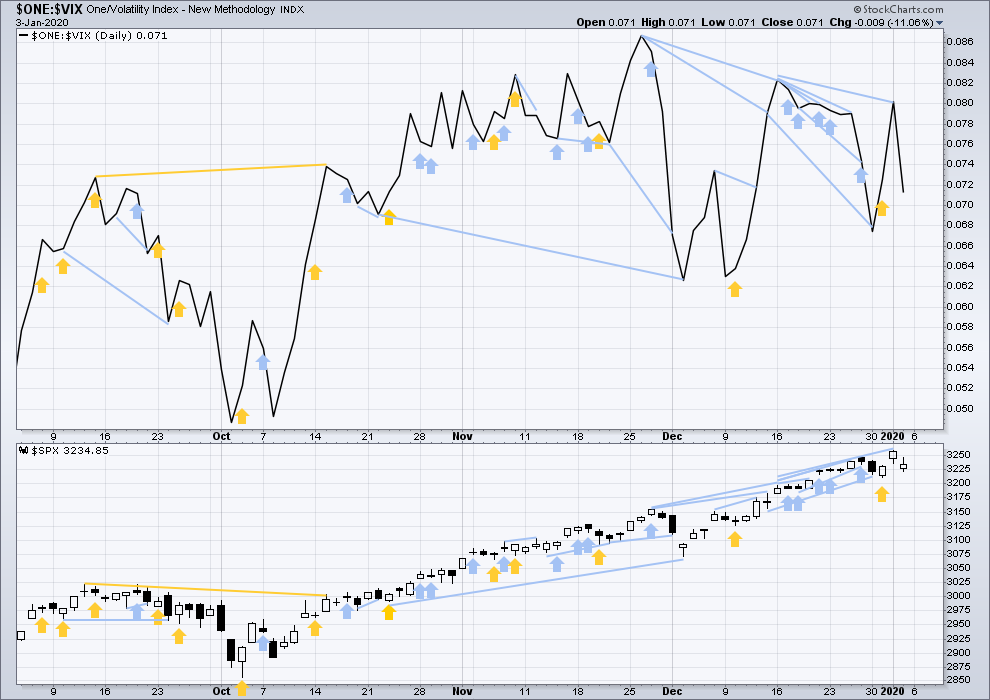
Click chart to enlarge. Chart courtesy of StockCharts.com. So that colour blind members are included, bearish signals will be noted with blue and bullish signals with yellow.
Both price and inverted VIX have moved lower on Friday. There is now new short-term divergence. All of short, mid and long-term bearish divergences between price and inverted VIX remain.
DOW THEORY
Dow Theory confirmed a bear market in December 2018. This does not necessarily mean a bear market at Grand Super Cycle degree though; Dow Theory makes no comment on Elliott wave counts. On the 25th of August 2015 Dow Theory also confirmed a bear market. The Elliott wave count sees that as part of cycle wave II. After Dow Theory confirmation of a bear market in August 2015, price went on to make new all time highs and the bull market continued.
DJIA: 23,344.52 – a close on the 19th of December at 23,284.97 confirms a bear market.
DJT: 9,806.79 – price has closed below this point on the 13th of December.
S&P500: 2,532.69 – a close on the 19th of December at 2,506.96 provides support to a bear market conclusion.
Nasdaq: 6,630.67 – a close on the 19th of December at 6,618.86 provides support to a bear market conclusion.
With all the indices having moved higher following a Dow Theory bear market confirmation, Dow Theory would confirm a bull market if the following highs are made:
DJIA: 26,951.81 – a close above this point has been made on the 3rd of July 2019.
DJT: 11,623.58 – to date DJT has failed to confirm an ongoing bull market.
S&P500: 2,940.91 – a close above this point was made on the 29th of April 2019.
Nasdaq: 8,133.30 – a close above this point was made on the 26th of April 2019.
GOLD
The main Elliott wave count expected overall upwards movement. Members were warned that upwards movement may exhibit an increase in momentum and volume for a blow off top. This is exactly what has happened to end the week.
Summary: Both wave counts now have the same target at 1,564 to 1,565. About this point a larger consolidation may develop, which may last about two weeks.
Grand SuperCycle analysis is here.
Monthly charts were last updated here.
BEARISH ELLIOTT WAVE COUNT
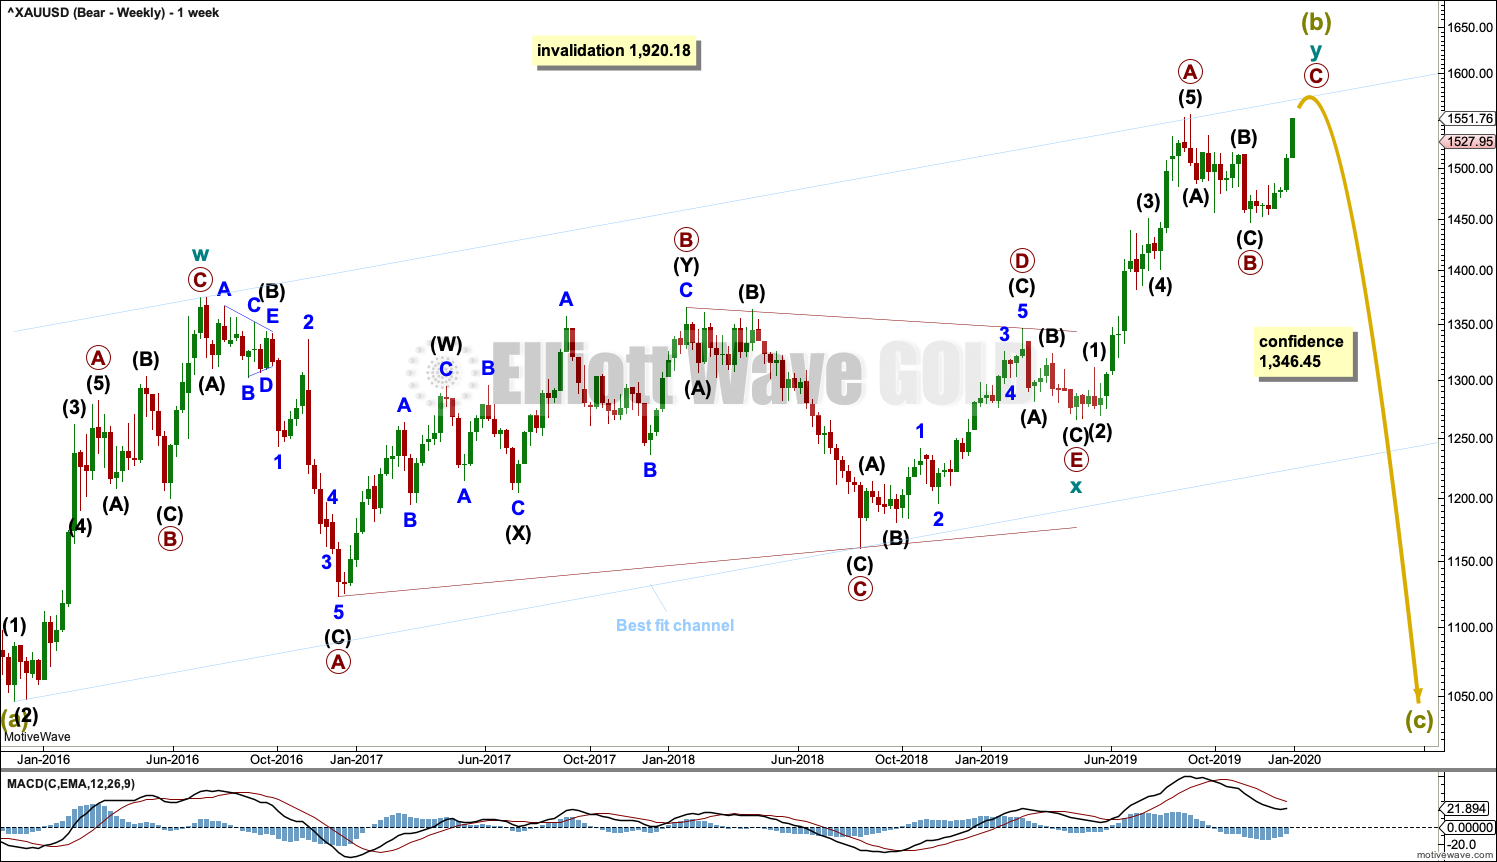
WEEKLY CHART
Click chart to enlarge.
Super Cycle wave (b) may still be an incomplete double zigzag, requiring one more high.
The first zigzag in the double is labelled cycle wave w. The double is joined by a three in the opposite direction, a triangle labelled cycle wave x. The second zigzag in the double is labelled cycle wave y.
The purpose of the second zigzag in a double is to deepen the correction. Cycle wave y has achieved this purpose.
After the structure of cycle wave y may be complete, then a new low below 1,346.45 would add strong confidence to this wave count. At that stage, the bullish Elliott wave count would be invalidated. At that stage, targets for Super Cycle wave (c) would be calculated.
A wide best fit channel is added in light blue. This channel contains all of Super Cycle wave (b) and may provide resistance and support. Copy this channel over to daily charts. If the target is wrong, it may not be quite high enough. Upwards movement may end if price comes up to touch the upper edge of the channel.
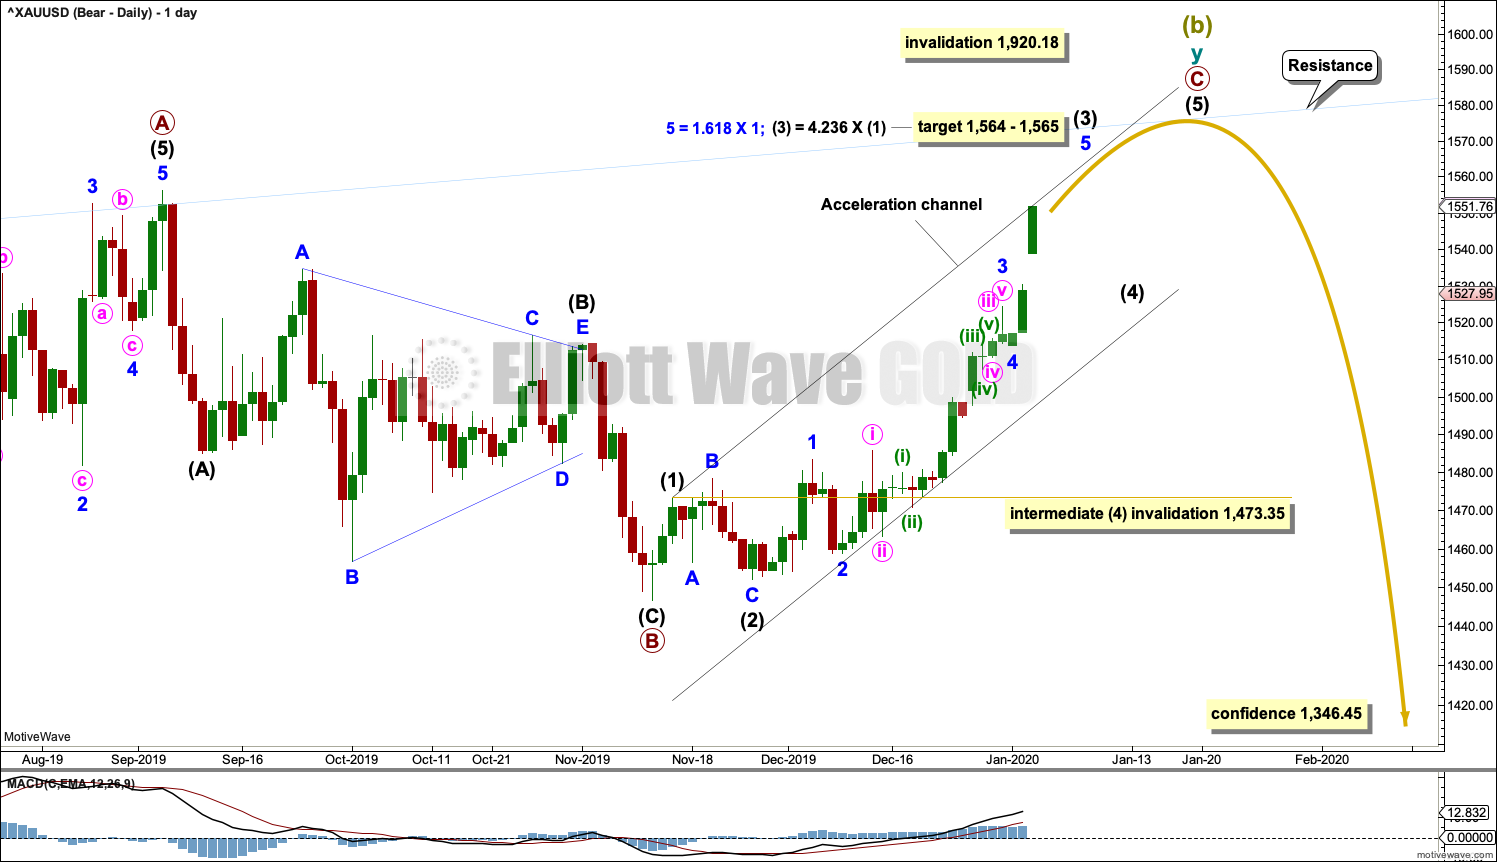
DAILY CHART
Click chart to enlarge.
It is possible that the double zigzag for Super Cycle wave (b) may be incomplete and may yet require one more high.
Within cycle wave y, primary wave A may have been over at the last high.
Primary wave B may be complete as a single zigzag. Within the zigzag, intermediate wave (C) is just 3.56 short of equality in length with intermediate wave (A). Intermediate wave (B) is a running contracting triangle.
Primary wave C would be expected to find strong resistance and end at the upper edge of the blue best fit channel copied over from the weekly chart.
Primary wave C must subdivide as a five wave structure. Within primary wave C, so far intermediate waves (1) and (2) may be complete. Intermediate wave (3) may only subdivide as an impulse. The middle of the impulse may be complete.
Draw an acceleration channel about primary wave C: draw the first trend line from the end of intermediate wave (1) to the last high, then place a parallel copy to contain all of primary wave C. Keep redrawing the channel as price continues higher. When intermediate wave (4) arrives, then it may find support about the lower edge of this channel.
Gold has a tendency to form blow off tops in bull markets. Blow off tops usually form as fifth waves ending third wave impulses one degree higher. Minor wave 5 has now formed a blow off top for intermediate wave (3), which may be nearing completion.
Intermediate wave (4) may not move into intermediate wave (1) price territory below 1,473.35.
A target is recalculated for intermediate wave (3) to end based upon two wave degrees.
The target for primary wave C is now removed. A target may again be calculated at intermediate degree when intermediate wave (4) may be complete.
BULLISH ELLIOTT WAVE COUNT
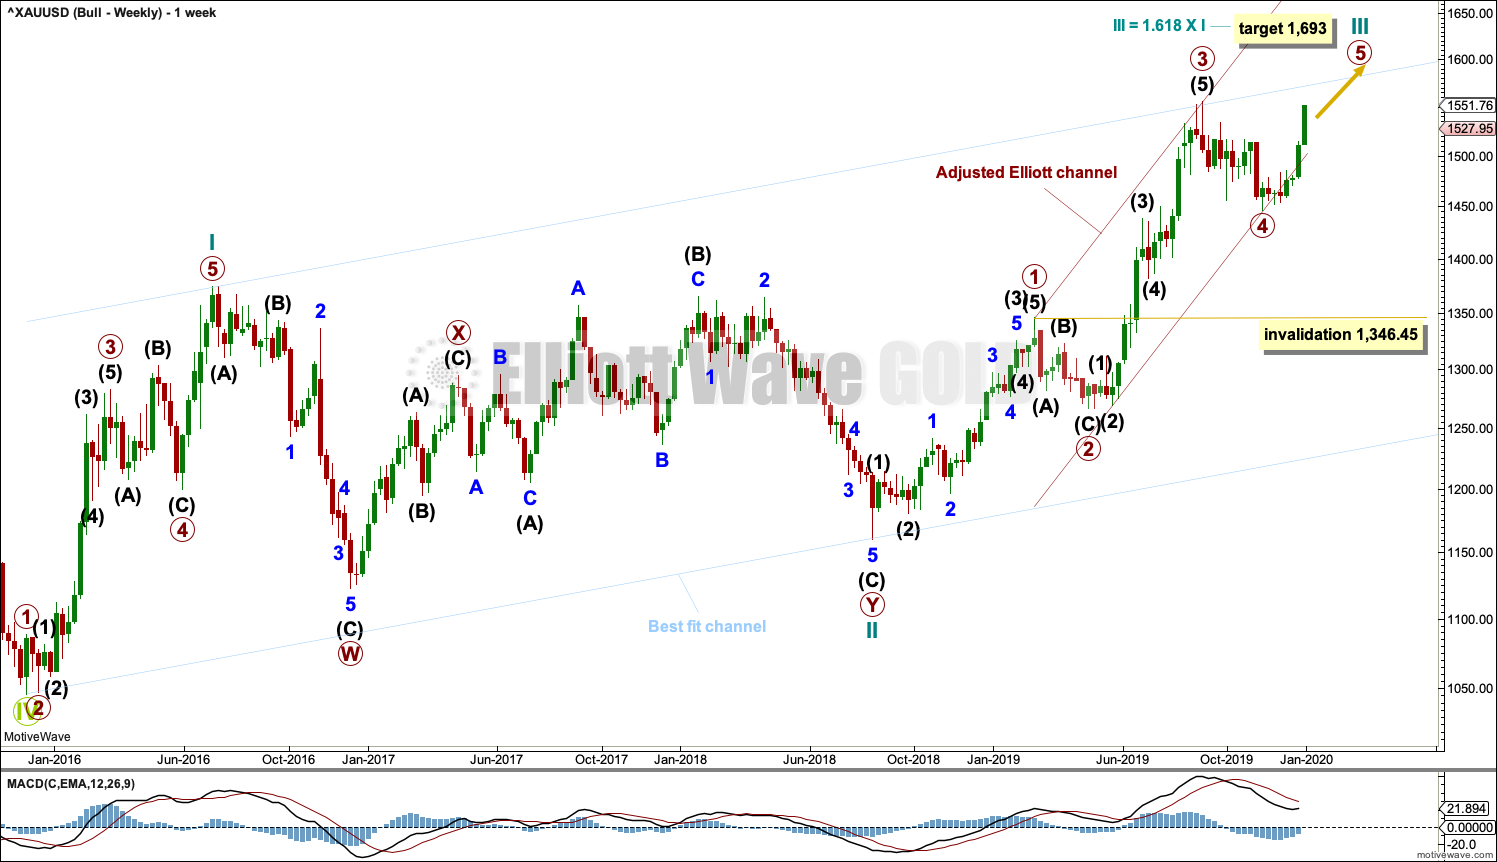
WEEKLY CHART
Click chart to enlarge.
This wave count sees the the bear market complete at the last major low for Gold in November 2015.
If Gold is in a new bull market, then it should begin with a five wave structure upwards on the weekly chart. However, the biggest problem with this wave count is the structure labelled cycle wave I because this wave count must see it as a five wave structure, but it looks more like a three wave structure.
Commodities often exhibit swift strong fifth waves that force the fourth wave corrections coming just prior and just after to be more brief and shallow than their counterpart second waves. It is unusual for a commodity to exhibit a quick second wave and a more time consuming fourth wave, and this is how cycle wave I is labelled. This wave count still suffers from this very substantial problem, which is one reason why the bearish wave count is preferred because it has a better fit in terms of Elliott wave structure.
Cycle wave II subdivides well as a double combination: zigzag – X – expanded flat.
Cycle wave III may have begun. Within cycle wave III, primary waves 1 and 2 may now be complete. Primary wave 3 has now moved above the end of primary wave 1 meeting a core Elliott wave rule. It has now moved far enough to allow room for primary wave 4 to unfold and remain above primary wave 1 price territory. Primary wave 4 may not move into primary wave 1 price territory below 1,346.45.
Cycle wave III so far for this wave count would have been underway now for 71 weeks. It exhibits some support from volume and increasing ATR. This wave count has some support from classic technical analysis.
The channel drawn about cycle wave III is an adjusted Elliott channel. The lower edge is pulled lower.
Add the wide best fit channel to weekly and daily charts.
DAILY CHART
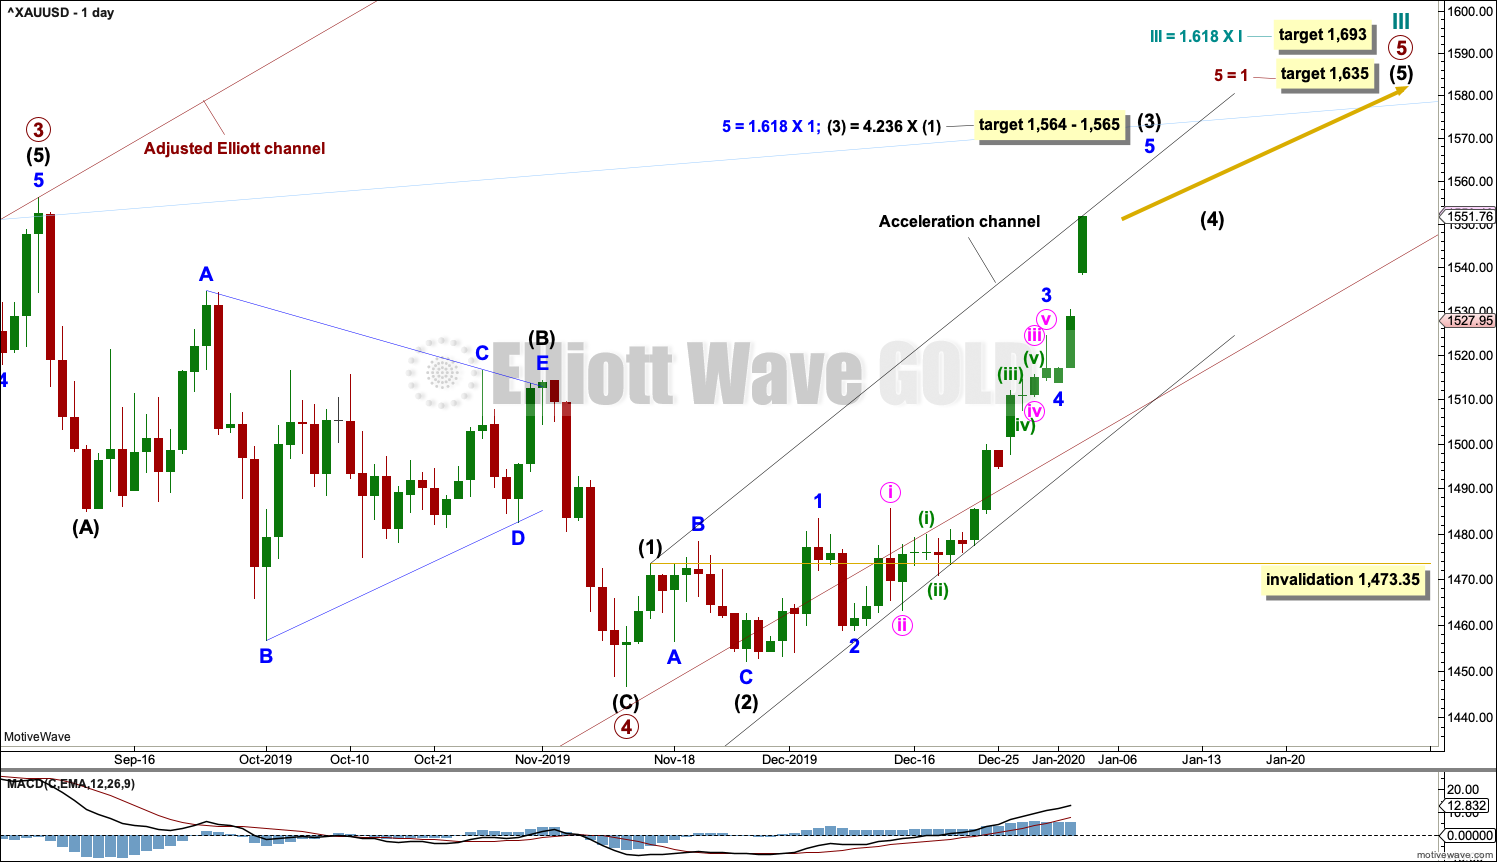
Click chart to enlarge.
Primary wave 4 may be complete as a single zigzag. Primary wave 4 may have lasted 49 sessions, just six more than primary wave 2, which lasted 43 sessions. The proportion remains very good for this part of the wave count.
A target for cycle wave III is calculated also now at primary degree. If price reaches the first target and keeps rising, then the second higher target may be used.
Primary wave 5 may only subdivide as a five wave structure, most likely an impulse. Within primary wave 5, intermediate wave (3) may only subdivide as an impulse.
Within the impulse of intermediate wave (3), minute wave iv may not move into minute wave i price territory below 1,485.71.
At this stage, this bullish Elliott wave count is essentially the same as the main bearish Elliott wave count in that both expect more upwards movement to new highs. The structure unfolding is the same, the degree of labelling is the same. The next target is now also the same.
TECHNICAL ANALYSIS
WEEKLY CHART
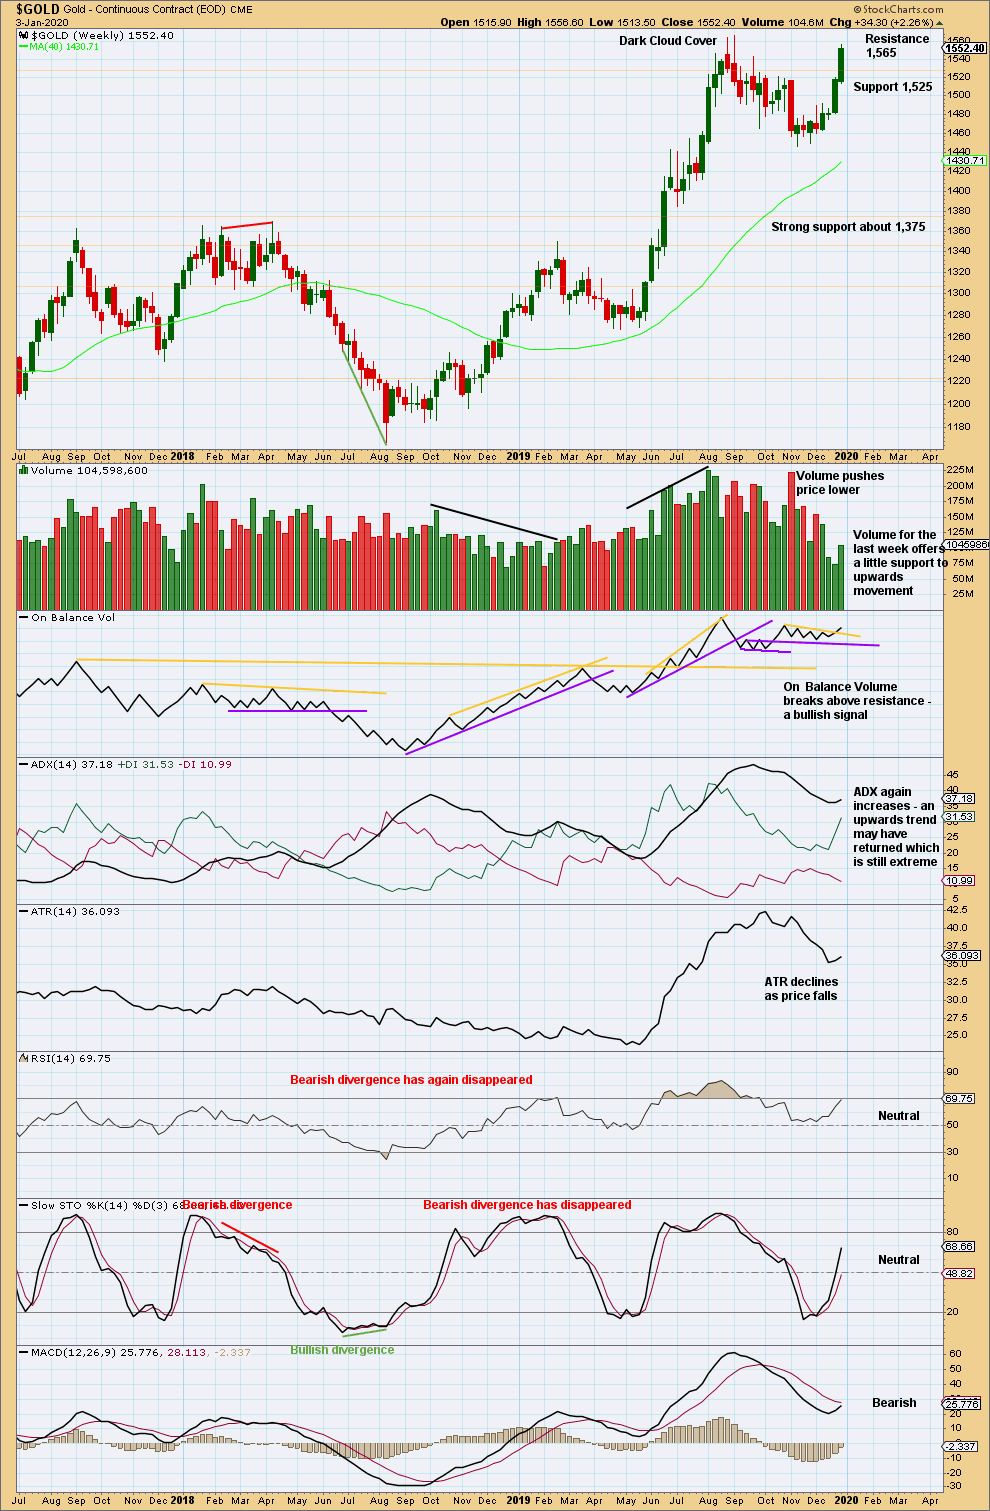
Click chart to enlarge. Chart courtesy of StockCharts.com.
Upwards movement continues. A bullish signal from On Balance Volume and some support this week from volume suggest upwards movement may continue futher to resistance above at 1,565.
DAILY CHART
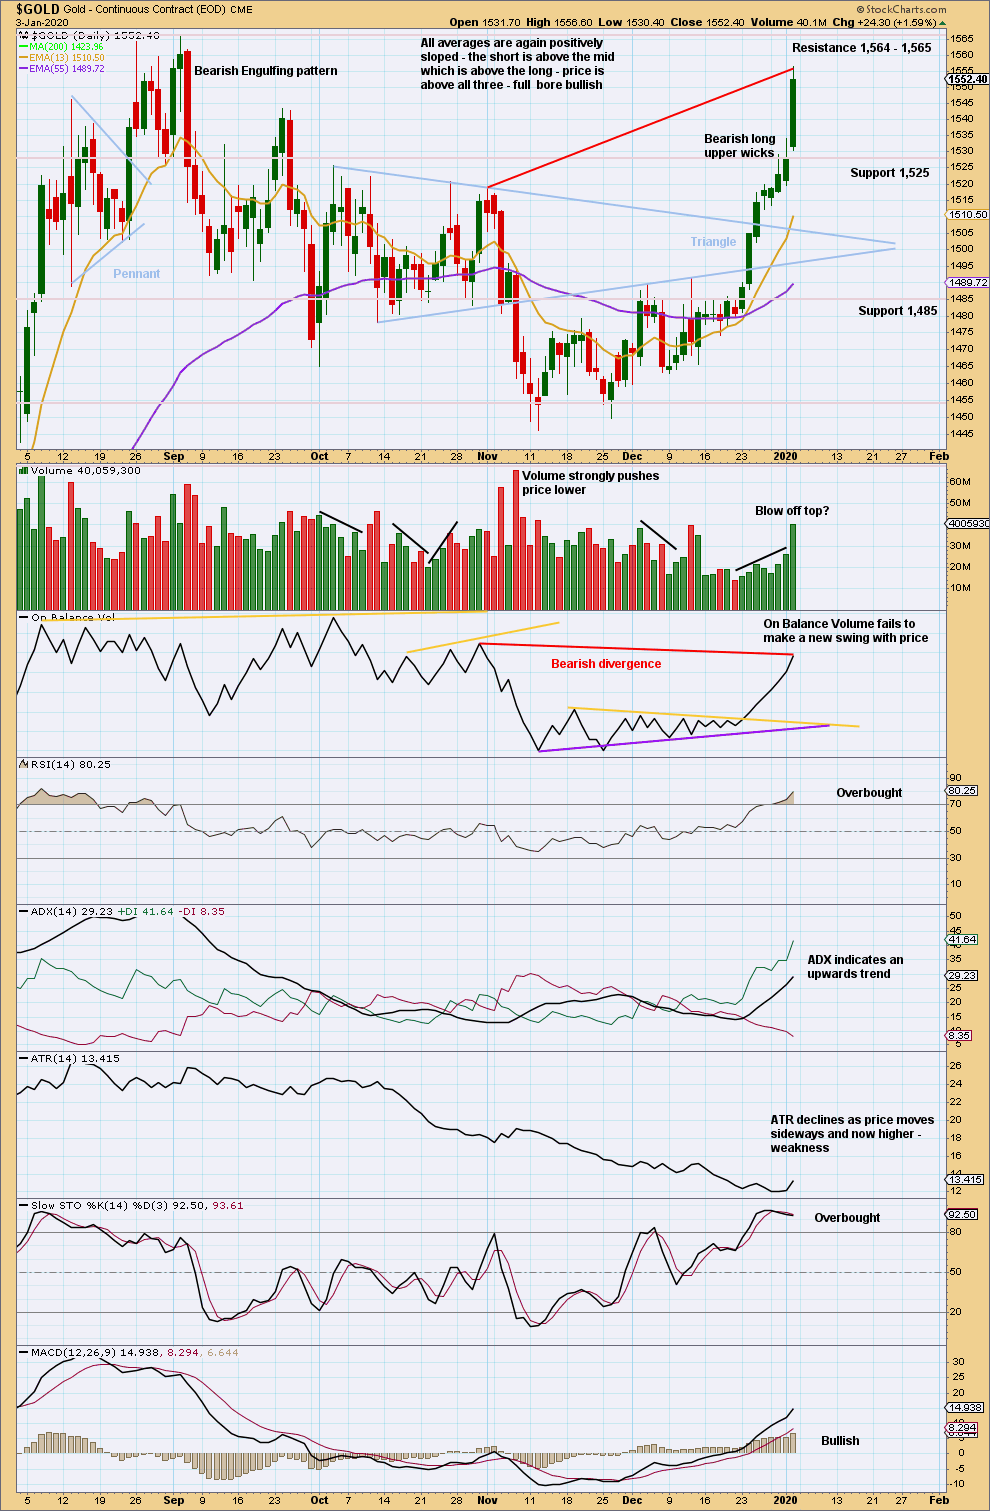
Click chart to enlarge. Chart courtesy of StockCharts.com.
Upwards movement may now continue higher to next resistance, which is strong about 1,564 – 1,565. As this agrees with Fibonacci ratios in the Elliott wave target, this zone has a high probability of providing resistance.
GDX WEEKLY CHART
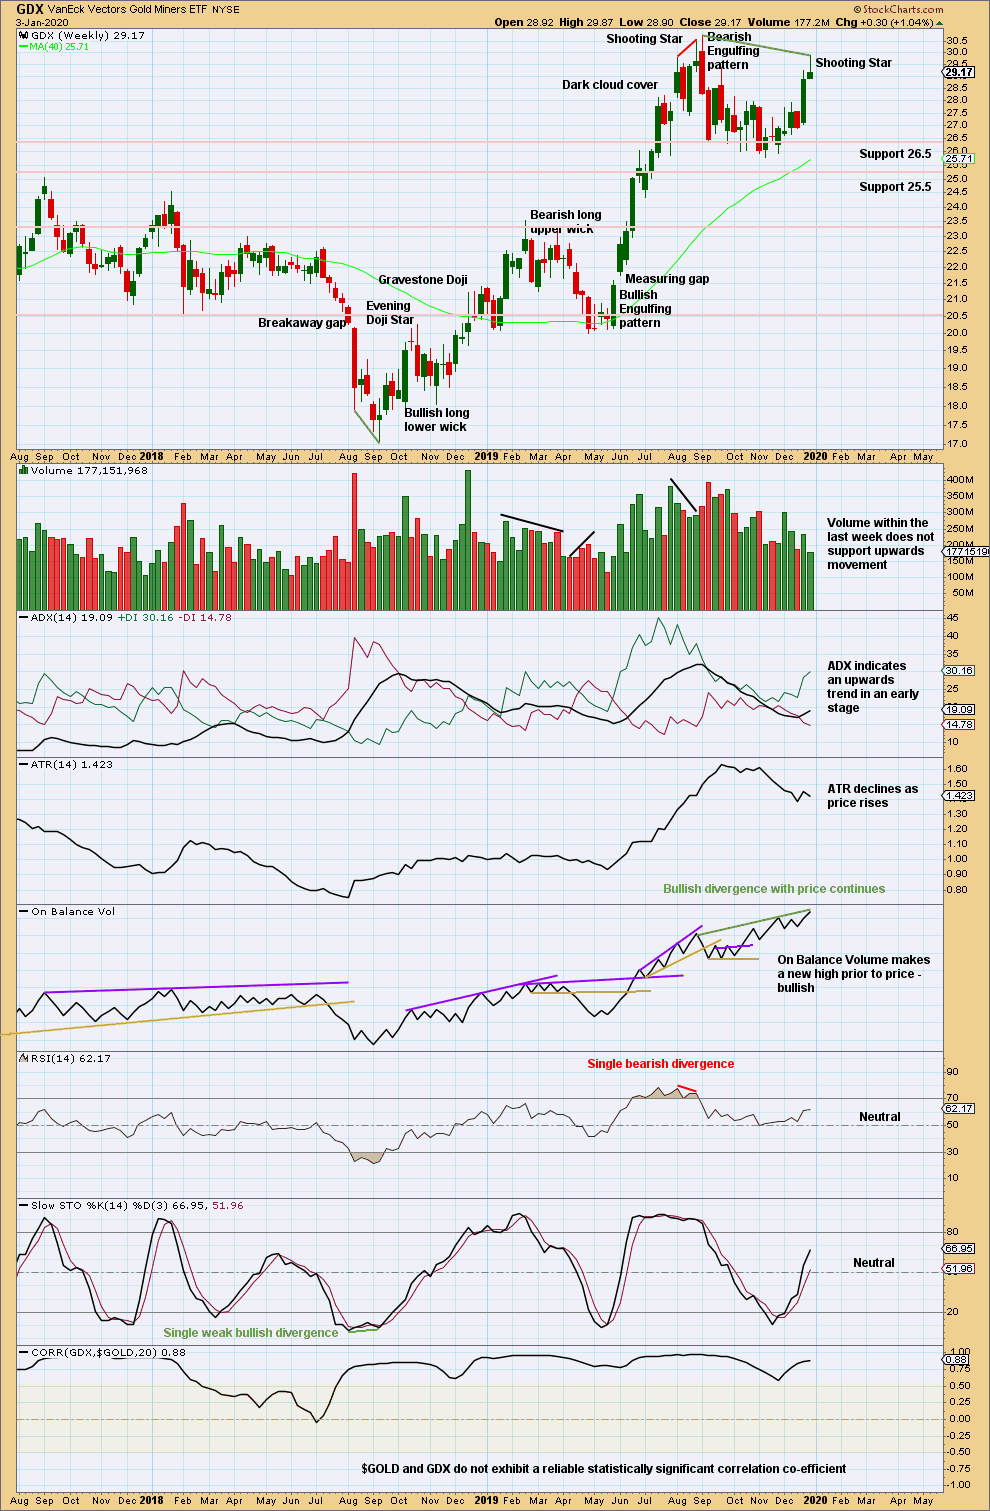
Click chart to enlarge. Chart courtesy of StockCharts.com.
A shooting star with declining volume this week suggests a consolidation may develop here for GDX.
Friday saw price move very strongly higher for Gold but overall lower for GDX. This is a perfect illustration of the lack of positive correlation between these two markets and why it is dangerous to assume that they must move in the same direction. The correlation co-efficient is added to the bottom of this chart to illustrate the data shows that any correlation that these two markets may have is unreliable.
GDX DAILY CHART
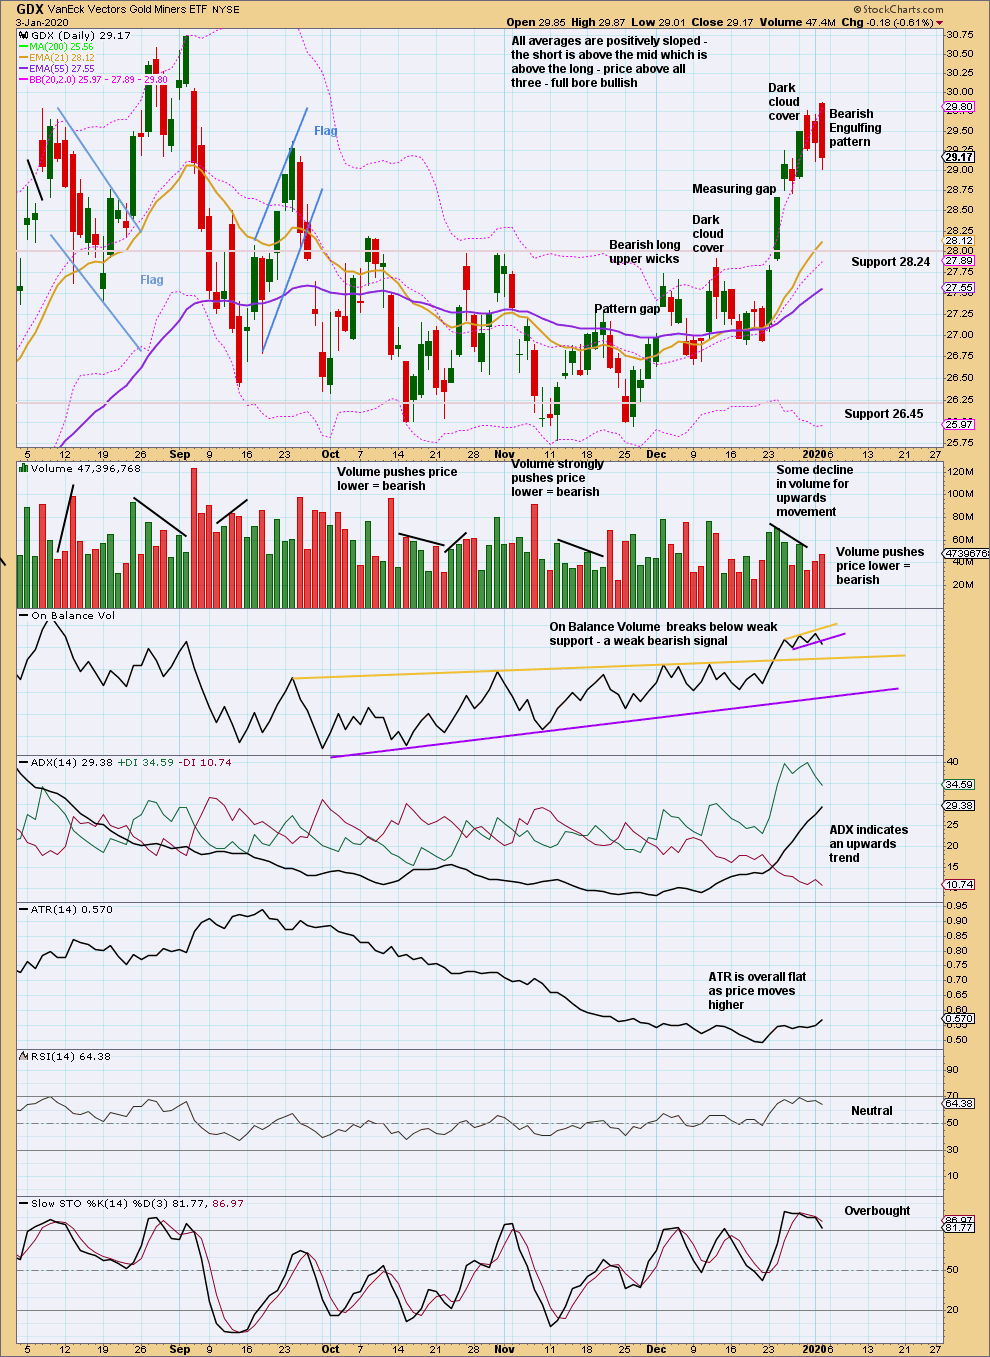
Click chart to enlarge. Chart courtesy of StockCharts.com.
For the short term, GDX is more bearish than Gold. It may move lower next week. Look for support about 28.24.
US OIL
The triangle has been invalidated and the alternate Elliott wave count, which considers a combination, is now the main Elliott wave count.
Summary: Both the bullish and bearish Elliott wave counts now expect downwards movement. Targets are either 47.25 or 44.05.
MAIN ELLIOTT WAVE COUNT – BEARISH
MONTHLY CHART

Click chart to enlarge.
The basic Elliott wave structure is five steps forward and three steps back. This Elliott wave count expects that US Oil is still within a three steps back pattern, which began in July 2008. The Elliott wave count expects that the bear market for US Oil continues.
This Elliott wave corrective structure is a double zigzag, which is a fairly common structure. The correction is labelled Super Cycle wave (II).
The first zigzag in the double is complete and labelled cycle wave w. The double is joined by a three in the opposite direction labelled cycle wave x, which subdivides as a zigzag. The second zigzag in the double may now have begun, labelled cycle wave y.
The purpose of a second zigzag in a double zigzag is to deepen the correction when the first zigzag does not move price deep enough. To achieve this purpose cycle wave y may be expected to move reasonably below the end of cycle wave w at 26.06. When primary wave B may be complete then the start of primary wave C may be known and a target may be calculated.
Cycle wave y is expected to subdivide as a zigzag, which subdivides 5-3-5.
Cycle wave w lasted 7.6 years and cycle wave x lasted 2.7 years. Cycle wave y may be expected to last possibly about a Fibonacci 5 or 8 years.
Primary wave B may not move beyond the start of primary wave A above 76.90.
WEEKLY CHART
Click chart to enlarge.
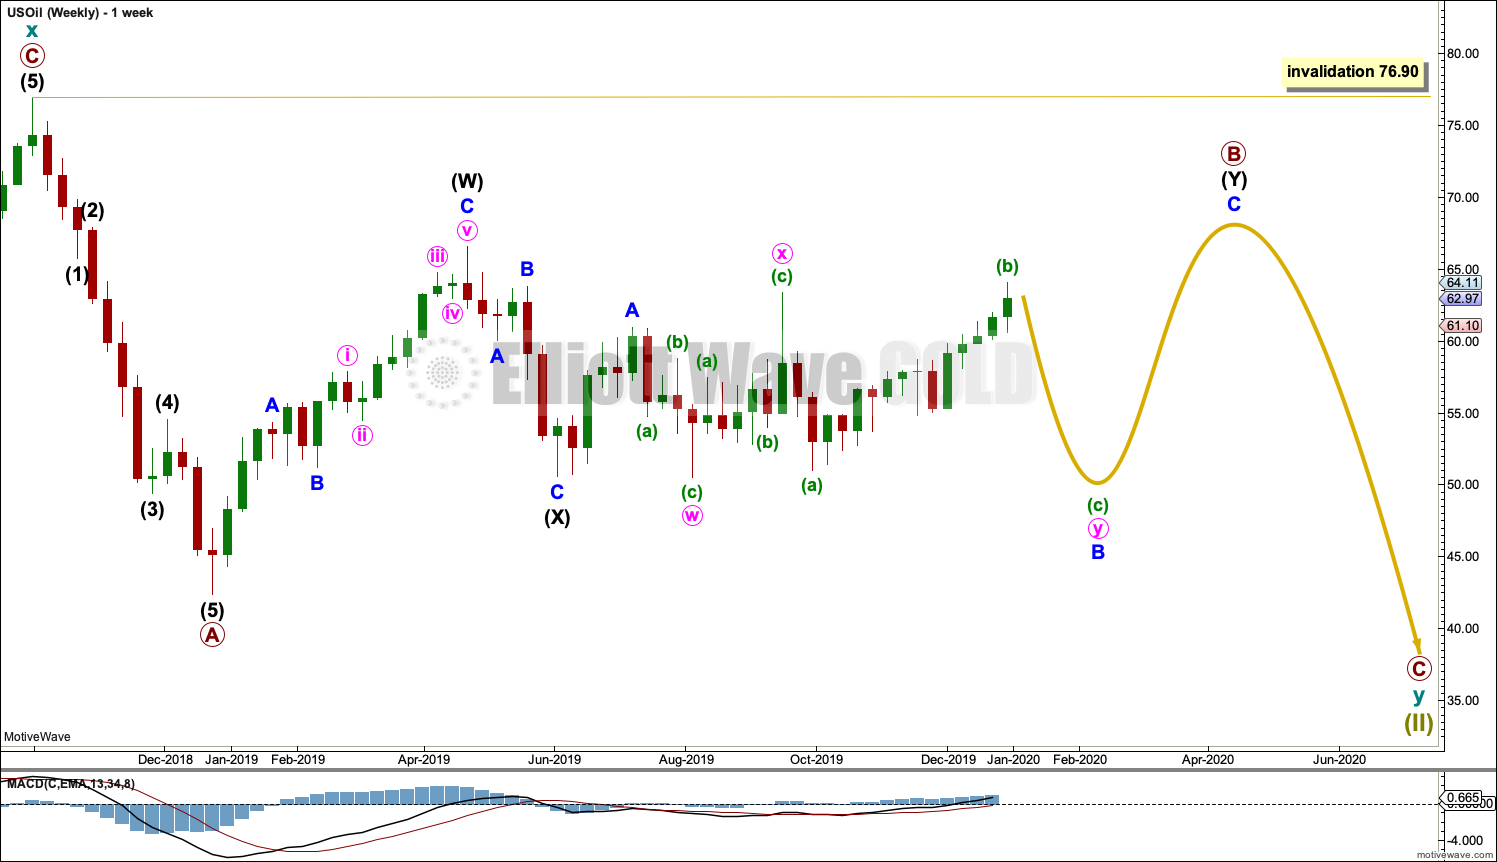
This weekly chart shows all of cycle wave y so far.
Cycle wave y is expected to subdivide as a zigzag. A zigzag subdivides 5-3-5. Primary wave A must subdivide as a five wave structure if this wave count is correct.
Primary wave A may be a complete five wave impulse at the last low.
This week a triangle for primary wave B was invalidated with a new high above 63.38. There is now only one wave count left for primary wave B.
Primary wave B may be a double combination: zigzag – X – flat. Intermediate wave (W) fits as a zigzag. Intermediate wave (Y) may be unfolding as a flat correction.
Within intermediate wave (Y), minor wave A may be complete. Minor wave B may be an incomplete double combination.
When primary wave B may be complete, then a downwards breakout would be expected for primary wave C.
Primary wave B may not move beyond the start of primary wave A above 76.90.
DAILY CHART

Click chart to enlarge.
This daily chart shows all of intermediate wave (Y) so far.
Intermediate wave (Y) may be subdividing as a flat correction. Within the flat, minor wave A subdivides as a three and minor wave B may be an incomplete three. At its end, minor wave B must retrace a minimum 0.9 of minor wave A at 51.74.
Minor wave B may be subdividing as a double combination: zigzag – X – flat. Within the flat correction of minute wave y, minuette wave (b) has now retraced the minimum requirement of 0.9 the length of minuette wave (a); minuette wave (b) is within the common range of 1 – 1.38 times the length of minuette wave (a). Minuette wave (c) should now move at least slightly below the end of minuette wave (a) at 51.00 to avoid a truncation and a very rare running flat. The target calculated expects a common Fibonacci ratio to minuette wave (a).
When minor wave B may be complete, then minor wave C should move higher to end above the end of minor wave A at 60.93.
This wave count now expects the consolidation that Oil has been in for some months now may continue for several more weeks. An upwards swing may be complete and a downwards swing may develop from here.
ALTERNATE ELLIOTT WAVE COUNT
MONTHLY CHART
Click chart to enlarge.
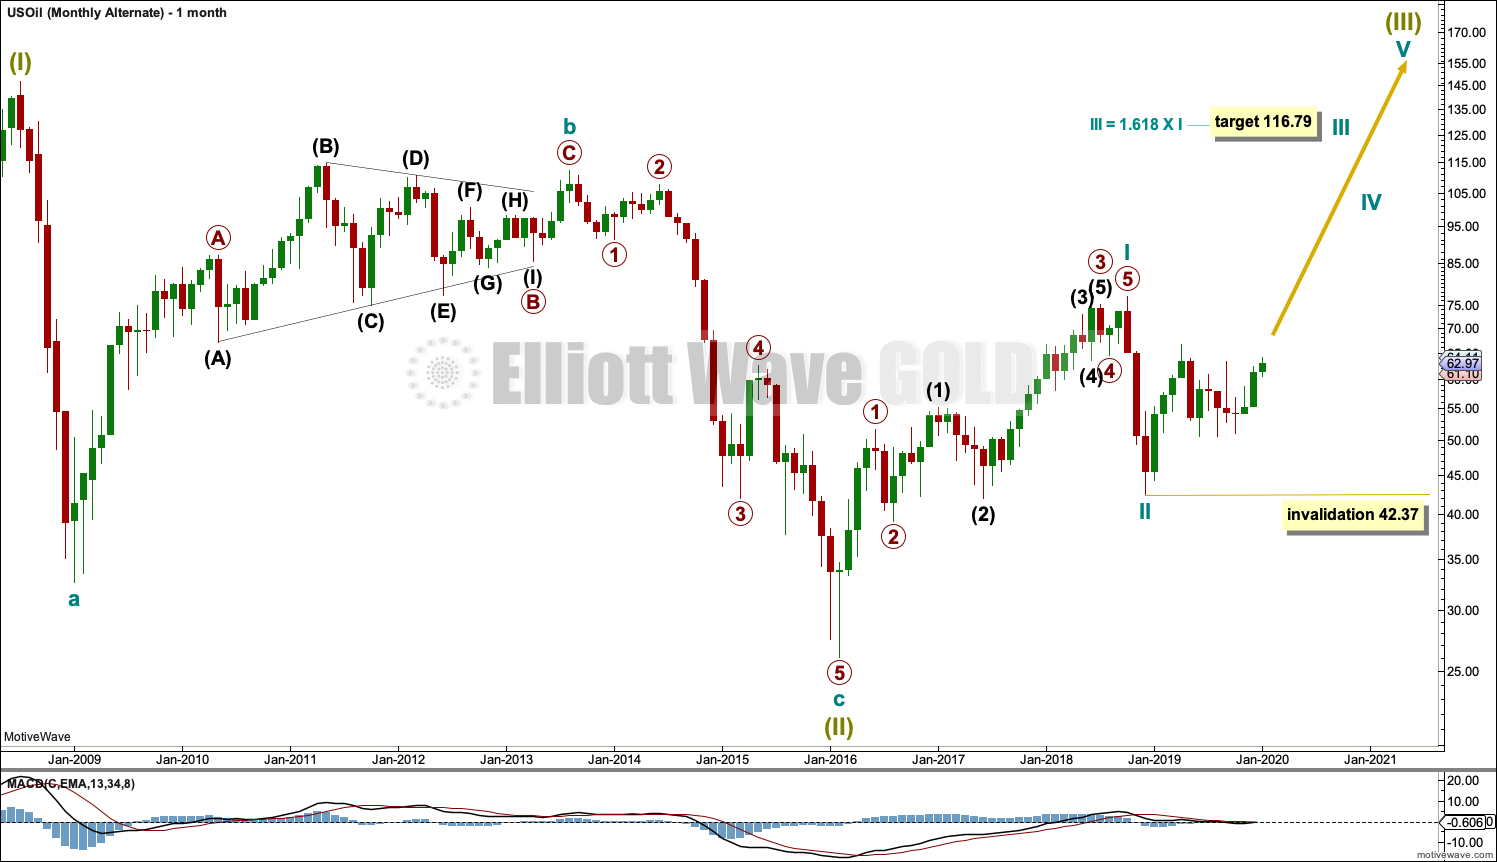
It is possible that the bear market is over for Oil and a new bull market has begun.
For a bullish wave count for Oil, the upwards wave from the major low at 26.06 in February 2016 must be seen as a complete five wave impulse. This is labelled cycle wave I.
Cycle wave II may be a complete zigzag at 0.679 the depth of cycle wave I.
A target is calculated for cycle wave III to reach a common Fibonacci ratio to cycle wave I.
Within cycle wave III, no second wave correction may move beyond the start of its first wave below 42.37.
WEEKLY CHART
Click chart to enlarge.
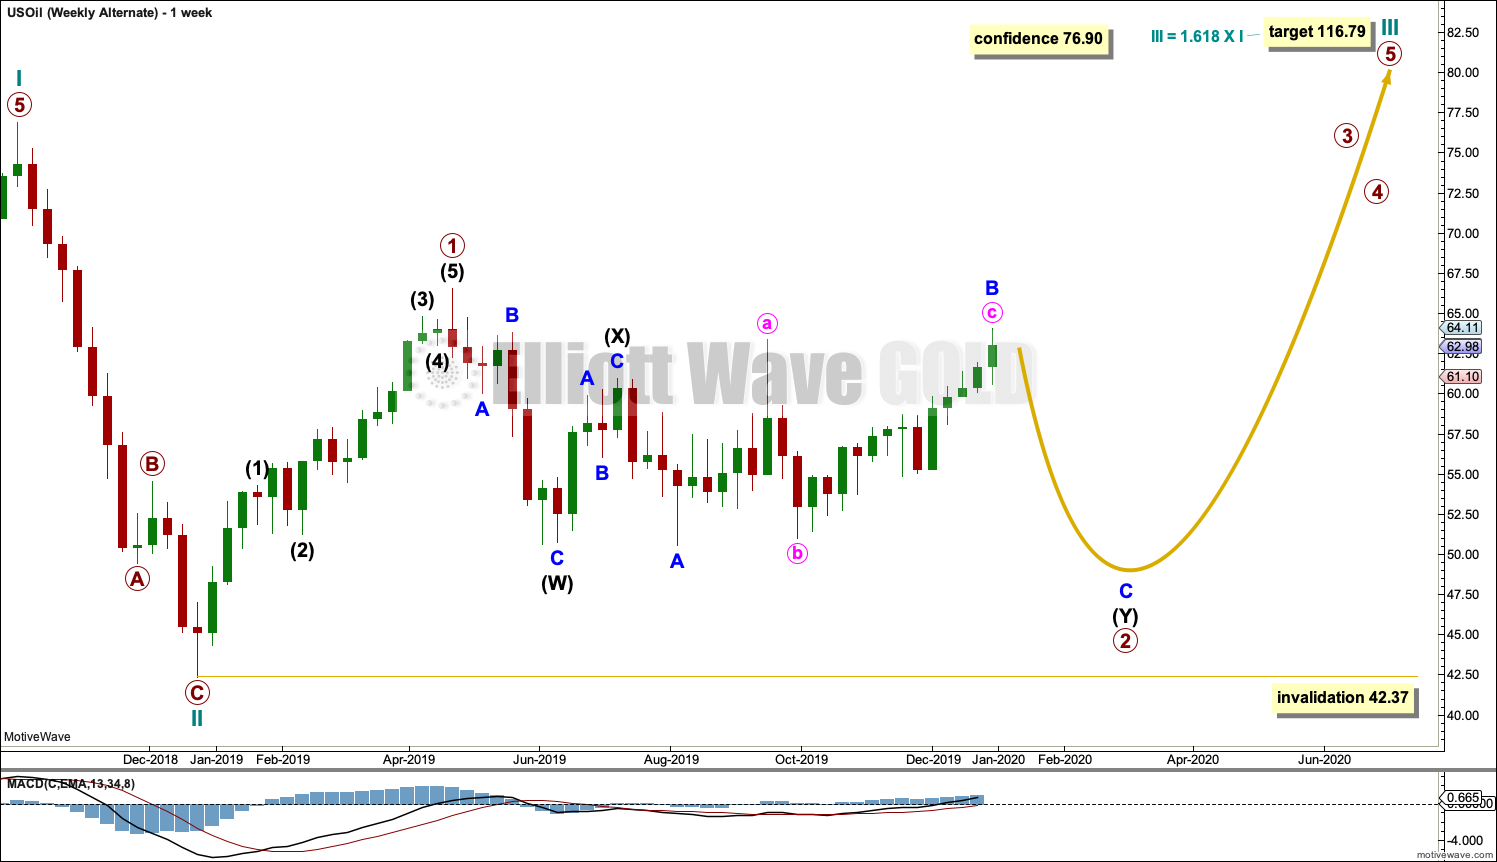
Cycle wave II does look best as a three. This is the only part of this wave count that has a better look than the main wave count, which sees this downwards wave as a five.
The upwards wave of primary wave 1 within cycle wave III must be seen as a five wave structure for a bullish wave count to work. This movement at lower time frames does not subdivide well as a five; this reduces the probability of this wave count.
Cycle wave III may only subdivide as an impulse. Within cycle wave III, so far primary wave 1 may be complete. Primary wave 2 may be moving sideways as a double combination. Primary wave 2 may not move beyond the start of primary wave 1 below 42.37.
Primary wave 2 may be continuing as a double combination.
The first structure in the double would be complete, a zigzag labelled intermediate wave (W). Within intermediate wave (W), minor wave C ends with a slight truncation for minute wave v. This is acceptable.
The double may be now joined by a complete three in the opposite direction, a zigzag labelled intermediate wave (X).
Intermediate wave (Y) may now be completing as an expanded flat correction.
DAILY CHART
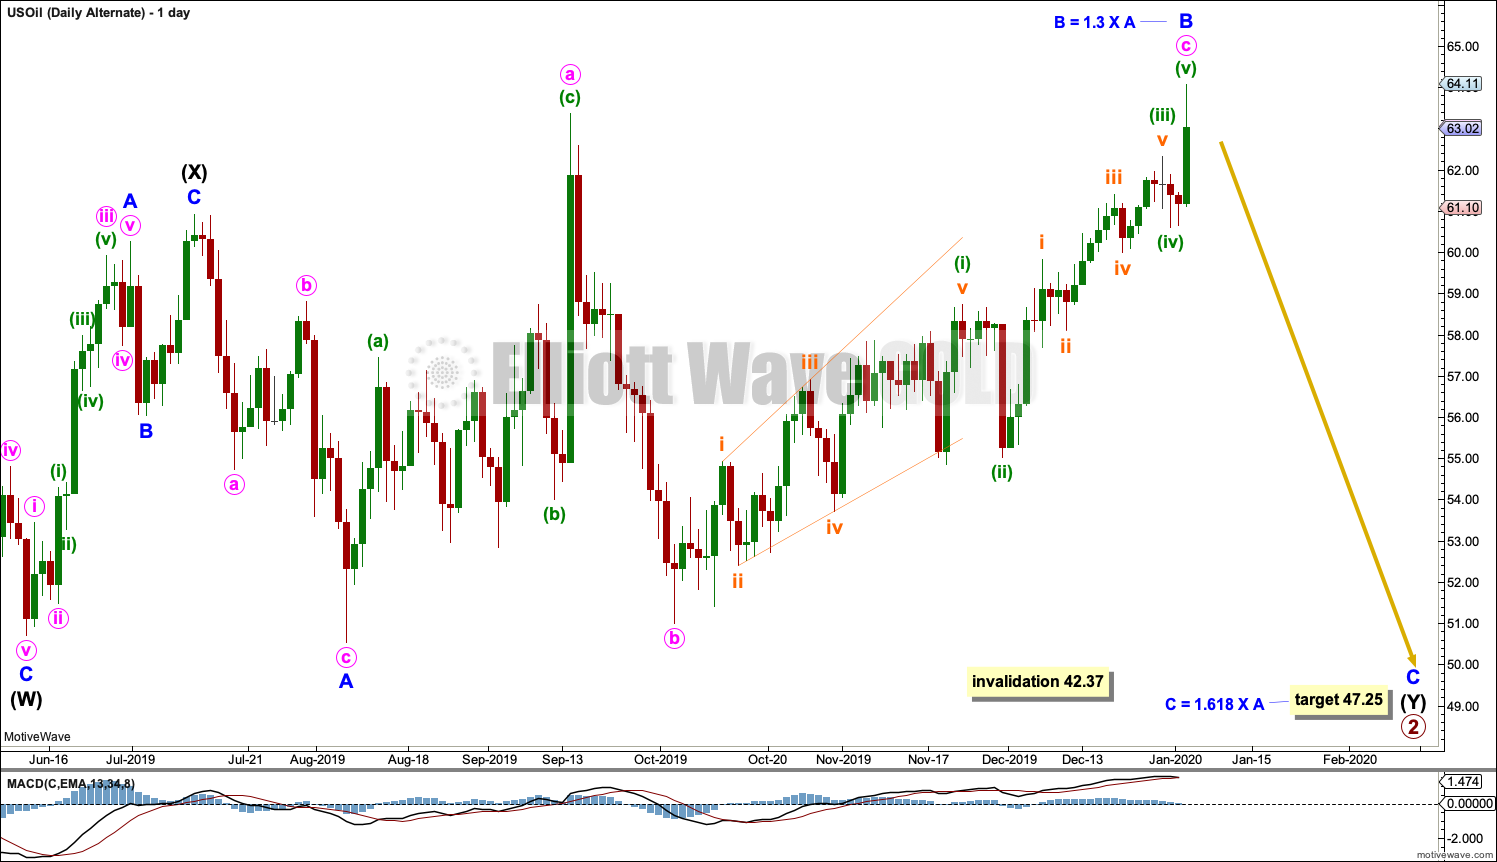
Click chart to enlarge.
A triangle for intermediate wave (Y) has been invalidated with a new high reasonably above 63.38.
Intermediate wave (Y) may be unfolding as an expanded flat correction. Within the expanded flat, minor wave A subdivides as a three and minor wave B may now be a complete three that is within the normal range of 1 to 1.38 times the length of minor wave A.
A target is calculated for minor wave C that expects a common Fibonacci ratio to minor wave A. Minor wave C would be likely to make at least a slight new low below the end of minor wave A at 50.53 to avoid a truncation and a very rare running flat.
Primary wave 2 may not move beyond the start of primary wave 1 below 42.37.
TECHNICAL ANALYSIS
MONTHLY CHART
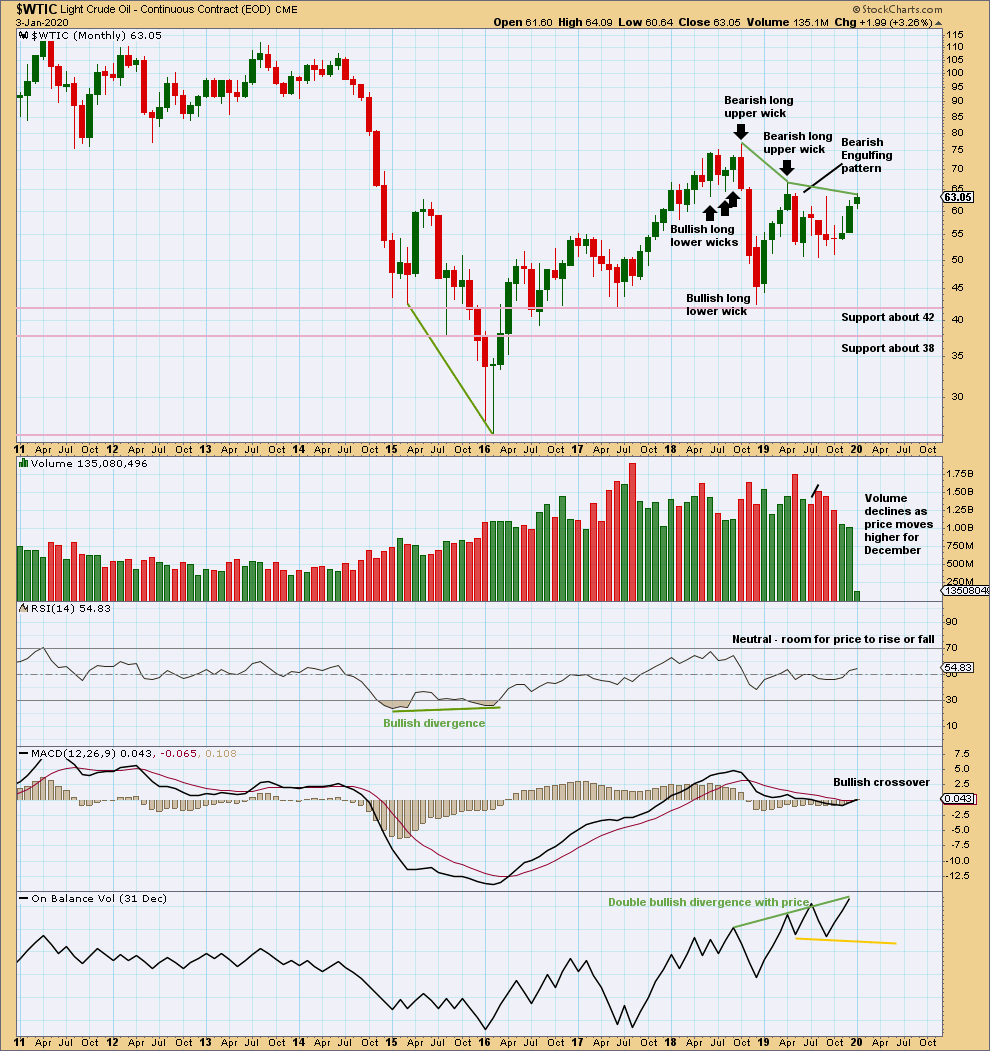
Click chart to enlarge. Chart courtesy of StockCharts.com.
There is now double bullish divergence between price and On Balance Volume. This supports the alternate Elliott wave count.
Overall, price has been moving sideways for a few months now. Within this sideways movement, the downwards month of May has greatest range and volume; this supports the main Elliott wave count. The last completed month of December 2019 closes within the range and lacks support from volume.
WEEKLY CHART
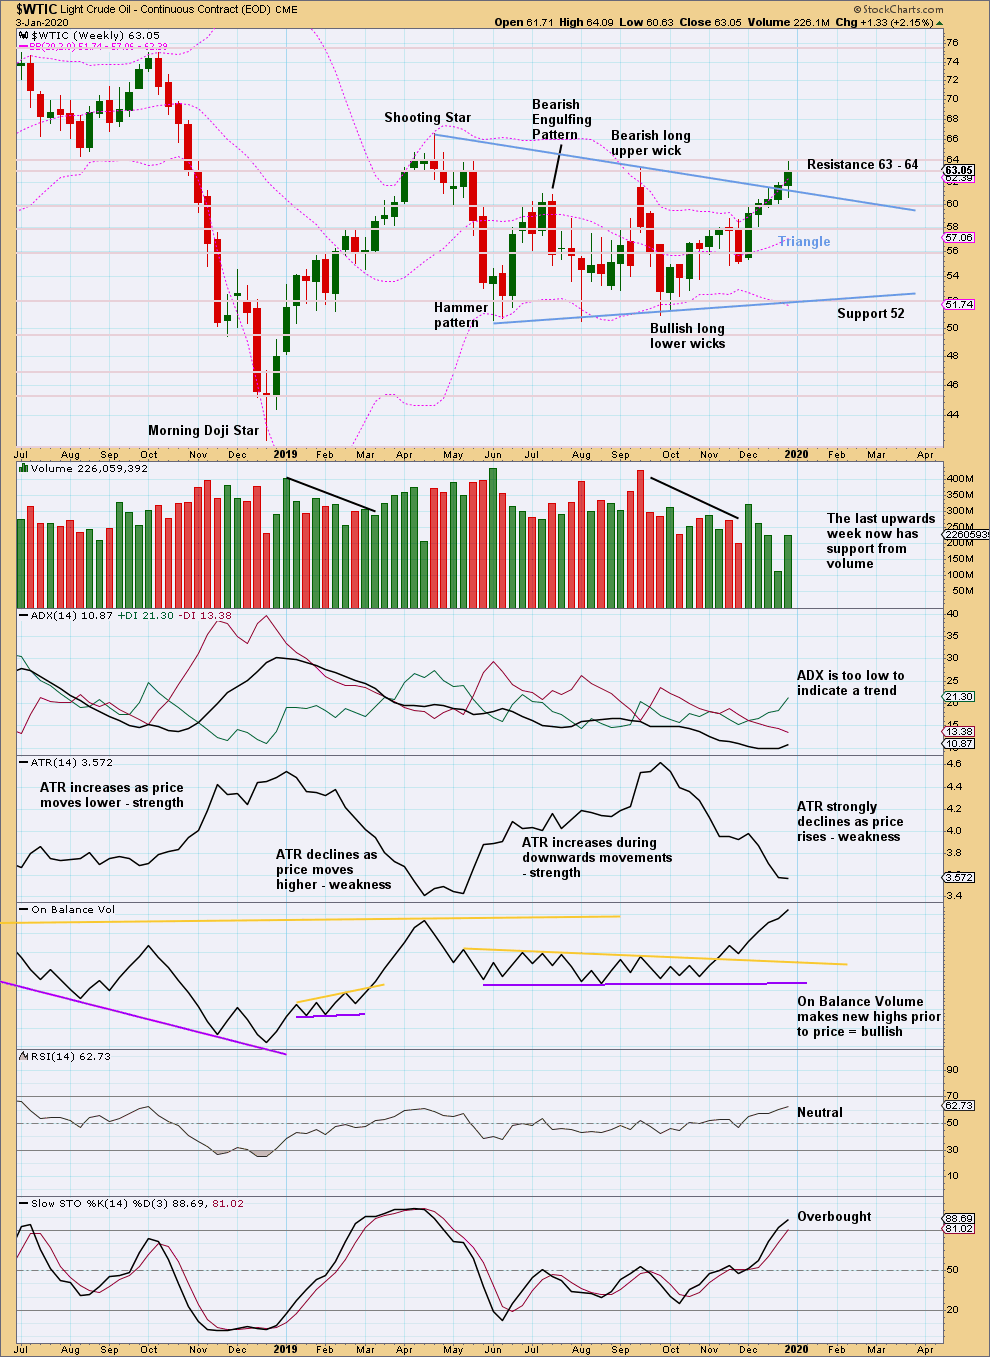
Click chart to enlarge. Chart courtesy of StockCharts.com.
A large triangle may be complete. The upwards breakout now has some support from volume.
A target calculated from the triangle would be at 77.21.
However, price remains within a larger consolidation zone and has not been able yet to overcome resistance at 64.
DAILY CHART
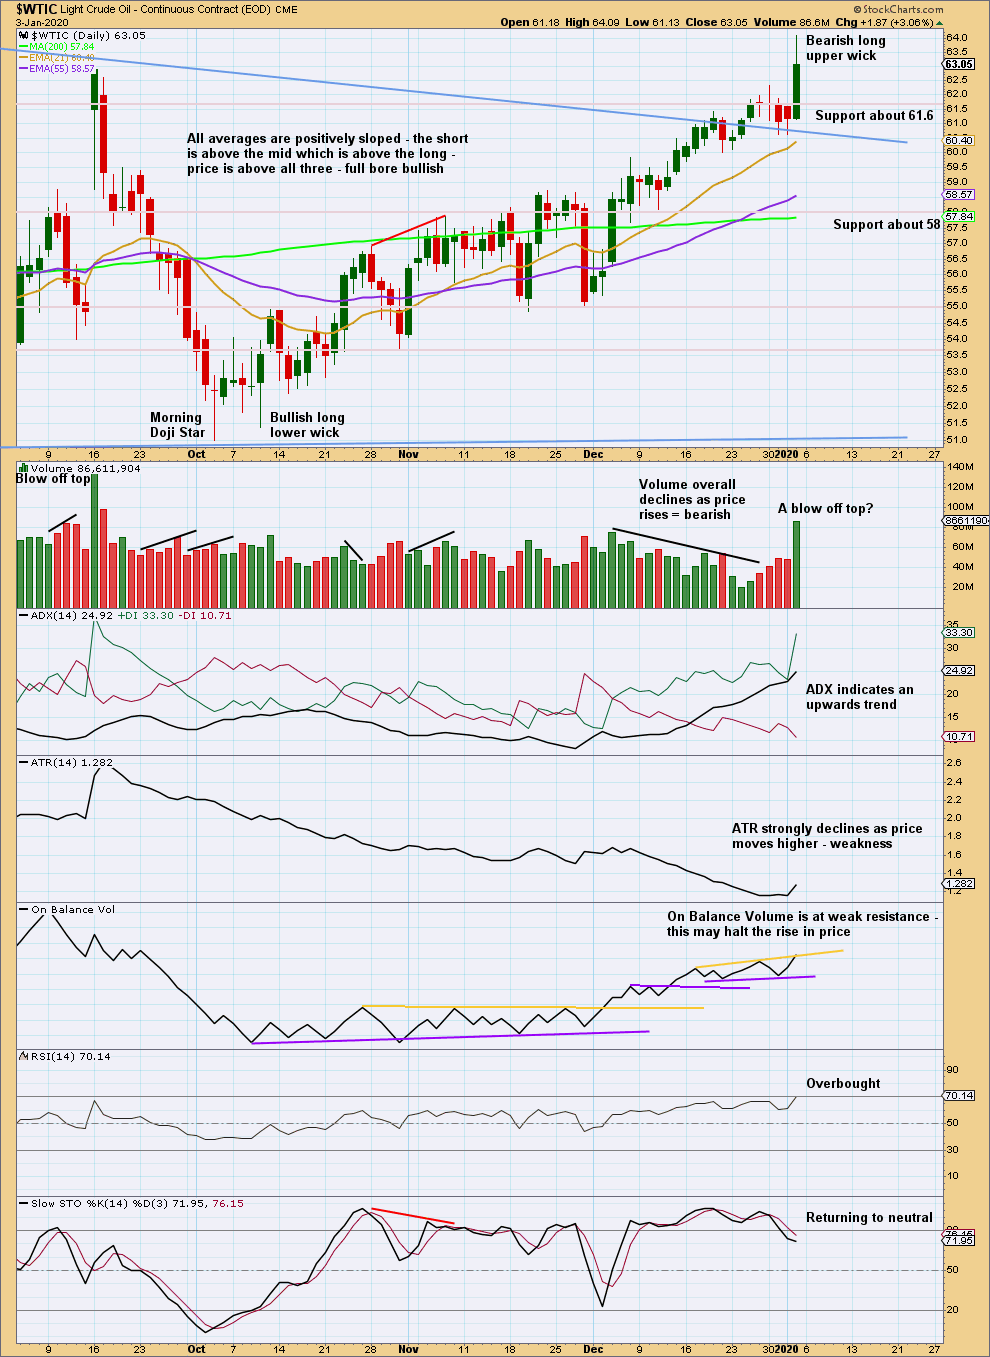
Click chart to enlarge. Chart courtesy of StockCharts.com.
There is currently an upwards trend in place at this time frame, but it lacks both support from volume and ATR. This trend is weak. Conditions are now extreme and price is at resistance (larger picture on the weekly chart level). This upwards trend at the daily chart level may be an upwards swing within the context of a larger consolidation, which may end here or soon.
—
Always practice good risk management as the most important aspect of trading. Always trade with stops and invest only 1-5% of equity on any one trade. Failure to manage risk is the most common mistake new traders make.
I’m just going to share with you all some pics of my beautiful country. I’m travelling for a few weeks around the South Island. This first pic is from the Catlins, this is Tautoko Bay.
Here’s a pic of the rainforest in the Catlins. It’s cold, about 60 degrees F, high rainfall. Equivalent to San Francisco and north.
And here’s a pic outside my window this morning. The Catlins again. It’s a really special place. Bottom RH corner of the South Island of New Zealand. A very low population density, I think there may be more tourists here than residents. Still, hardly anyone else around.
Beautiful pics!
Beautiful country!
Thanks for sharing
Been to Australia but unfortunately never to New Zealand.
Rich
This weeks SPX recovery from the threat of potential War had me looking at the Monthly. Appears this month could be pivotal as the MACD is very close to new high.
I am expecting minor 4 to begin sooner rather than later now for the S&P.
Hi all,
Has anyone started a short position on oil? The volatility at the start of the week was scary, but us oil closed strongly below 64, so I decided to enter short around 63.
Comment on Gold:
Intermediate (3) has continued higher. It may be over here, as labelled, or it may be over very soon. If price continues to make another high then intermediate wave (3) may be continuing and the next target may be at 1,635.
If intermediate (4) begins here then expect it may last a Fibonacci 5 or 8 sessions and may now find support at the upper edge of the blue best fit channel which is copied over from the weekly chart.
Hi Lara, happy new year. Bitcoin has moved up around $1500 since a week before Christmas. Have you looked at the chart recently?
Hi, and a very Happy New Year to you too.
It looks like BitCoin may have found its low, finally. The movement up off the last low was very strong. I may find some time this week to update the BitCoin analysis.
Great, thanks Lara. I also drew a trend line which it seems to have obeyed yesterday. I’ll upload later today to get your opinion.