

S&P 500
A continuation of sideways movement overall was expected for this week. A small pattern may be developing on the daily chart, which may provide a classic technical analysis target to supplement the Elliott wave target.
Summary: The low of December 2018 is expected to most likely remain intact.
The current consolidation may end next week and may continue to be very shallow. A third wave up may then continue and may exhibit an increase in strength. The target remains at 3,104.
The biggest picture, Grand Super Cycle analysis, is here.
Monthly charts were last published here, with video here. There are two further alternate monthly charts here. Video is here.
ELLIOTT WAVE COUNTS
The two Elliott wave counts below will be labelled First and Second. They may be about of even probability. When the fifth wave currently unfolding on weekly charts may be complete, then these two wave counts will diverge on the severity of the expected following bear market. To see an illustration of this future divergence monthly charts should be viewed.
FIRST WAVE COUNT
WEEKLY CHART
Click chart to enlarge.
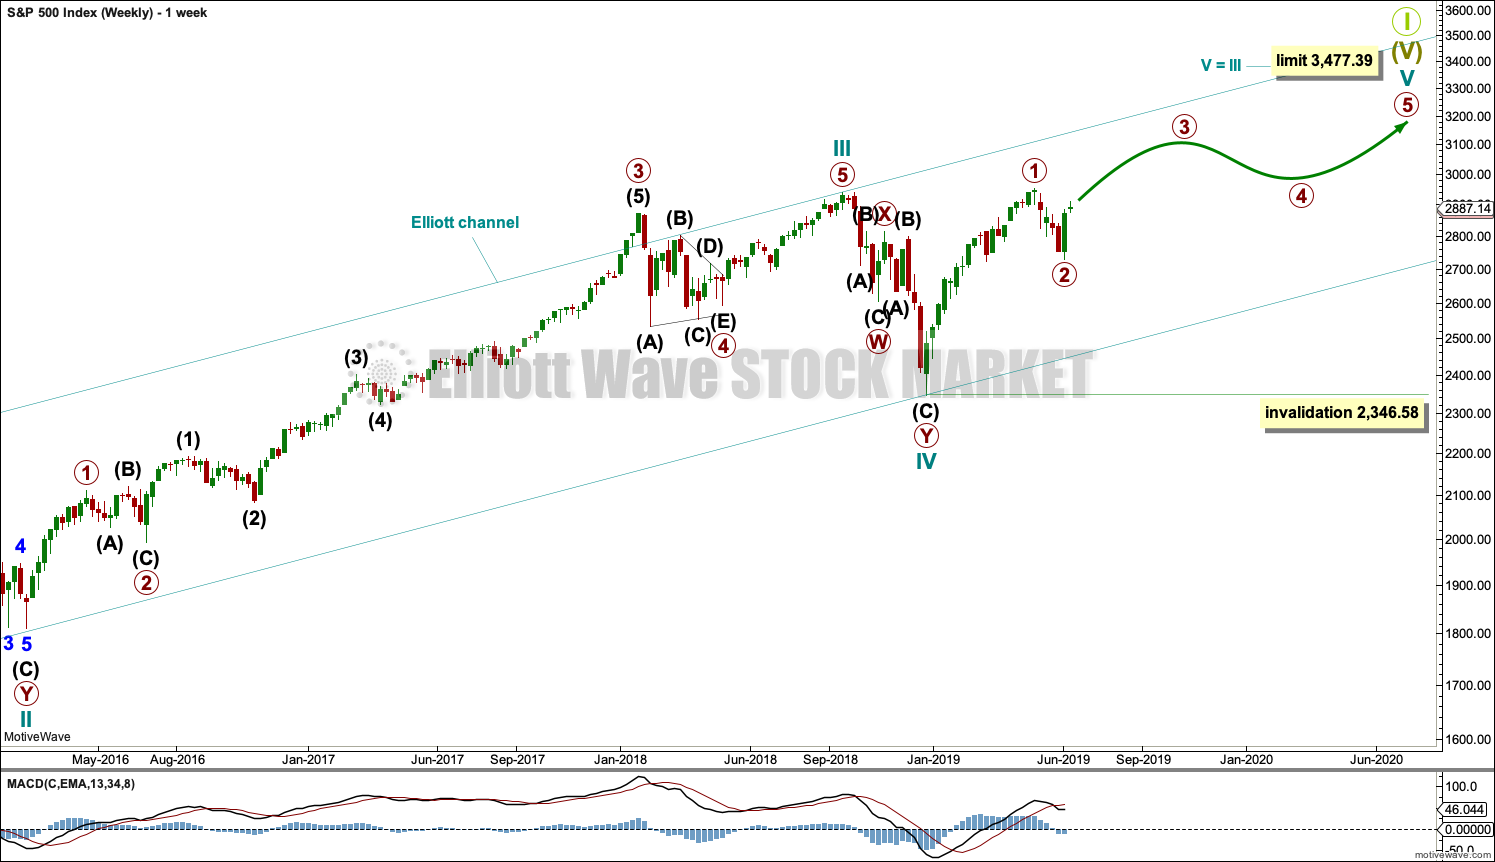
The basic Elliott wave structure consists of a five wave structure up followed by a three wave structure down (for a bull market). This wave count sees the bull market beginning in March 2009 as an incomplete five wave impulse and now within the last fifth wave, which is labelled cycle wave V. This impulse is best viewed on monthly charts. The weekly chart focusses on the end of it.
Elliott wave is fractal. This fifth wave labelled cycle wave V may end a larger fifth wave labelled Super Cycle wave (V), which may end a larger first wave labelled Grand Super Cycle wave I.
The teal Elliott channel is drawn using Elliott’s first technique about the impulse of Super Cycle wave (V). Draw the first trend line from the end of cycle wave I (off to the left of the chart, the weekly candlestick beginning 30th November 2014) to the end of cycle wave III, then place a parallel copy on the end of cycle wave II. This channel perfectly shows where cycle wave IV ended at support. The strongest portion of cycle wave III, the end of primary wave 3, overshoots the upper edge of the channel. This is a typical look for a third wave and suggests the channel is drawn correctly and the way the impulse is counted is correct.
Within Super Cycle wave (V), cycle wave III is shorter than cycle wave I. A core Elliott wave rule states that a third wave may never be the shortest. For this rule to be met in this instance, cycle wave V may not be longer in length than cycle wave III. This limit is at 3,477.39.
The structure of cycle wave V is focussed on at the daily chart level below.
Within cycle wave V, primary wave 2 may not move beyond the start of primary wave 1 below 2,346.58.
In historic analysis, two further monthly charts have been published that do not have a limit to upwards movement and are more bullish than this wave count. Members are encouraged to consider those possibilities (links below summary) alongside the wave counts presented on a daily and weekly basis.
DAILY CHART
Click chart to enlarge.
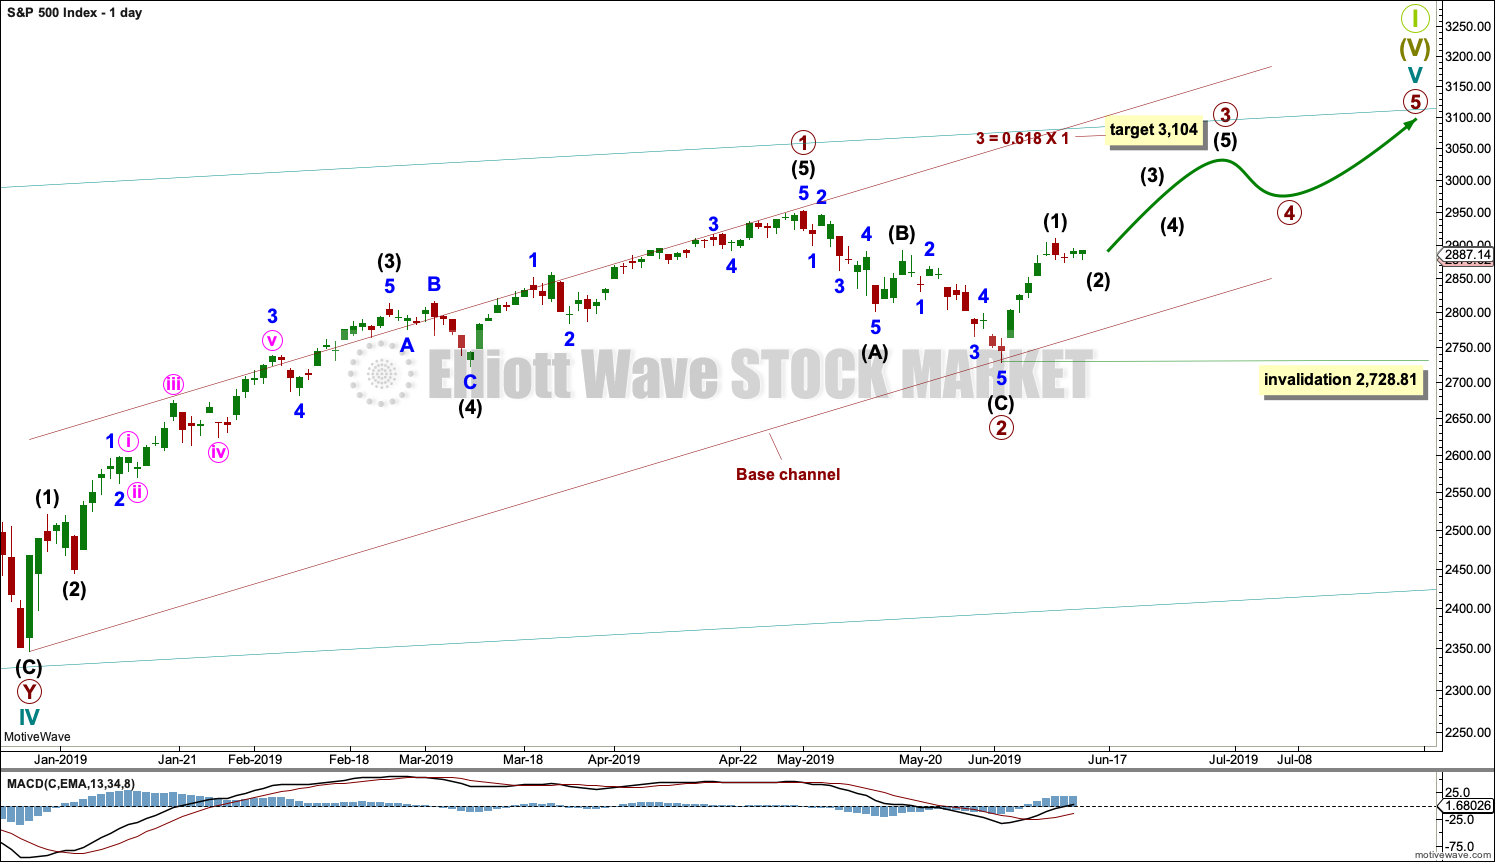
Cycle wave V must subdivide as a five wave motive structure. Within that five wave structure, primary waves 1 and 2 may be complete.
Primary wave 3 must move above the end of primary wave 1. Primary wave 3 may only subdivide as an impulse. Within the impulse, intermediate wave (2) may not move beyond the start intermediate wave (1) below 2,728.81.
When primary wave 3 is over, then primary wave 4 may be a shallow sideways consolidation that may not move into primary wave 1 price territory below 2,954.13.
Thereafter, primary wave 5 should move above the end of primary wave 3 to avoid a truncation.
A base channel is drawn about primary waves 1 and 2. The lower edge is drawn from the start of primary wave 1 to the end of primary wave 2, then a parallel copy is placed upon the high of primary wave 1. Along the way up, corrections within primary wave 3 may find support about the lower edge of the base channel. Primary wave 3 may have the power to break above the upper edge of the channel.
Primary wave 1 lasted 86 sessions, 3 short of a Fibonacci 89. Primary wave 2 lasted 22 sessions, 1 longer than a Fibonacci 21. Primary wave 3 may end about a Fibonacci 55 sessions, give or take two or three sessions either side. This is a rough guideline only.
So far primary wave 3 has lasted 9 sessions.
SECOND WAVE COUNT
WEEKLY CHART
Click chart to enlarge.
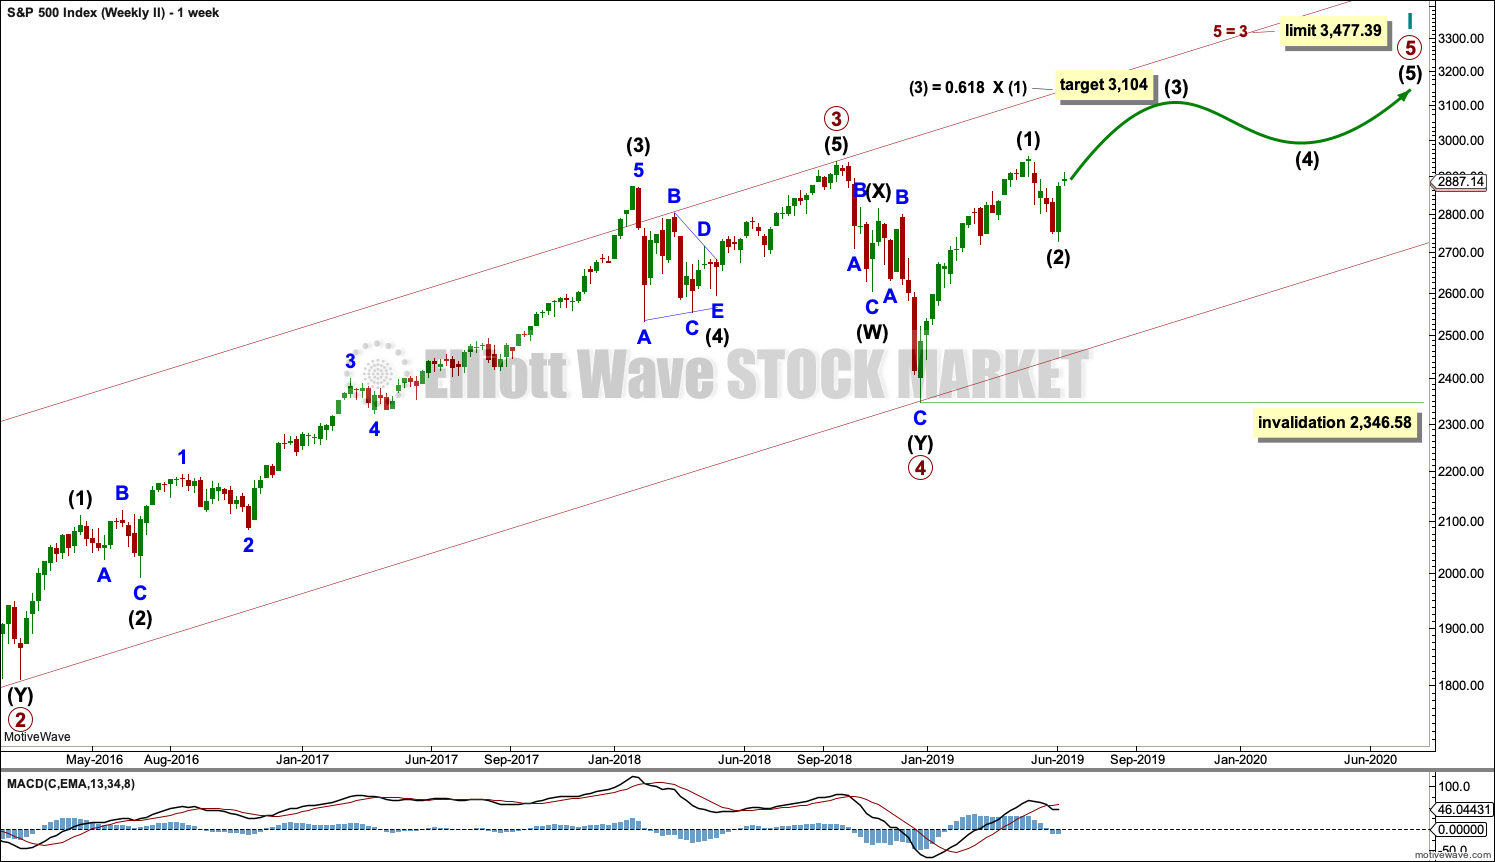
This weekly chart is almost identical to the first weekly chart, with the sole exception being the degree of labelling.
This weekly chart moves the degree of labelling for the impulse beginning in March 2009 all down one degree. This difference is best viewed on monthly charts.
The impulse is still viewed as nearing an end; a fifth wave is still seen as needing to complete higher. This wave count labels it primary wave 5.
TECHNICAL ANALYSIS
WEEKLY CHART
Click chart to enlarge. Chart courtesy of StockCharts.com.
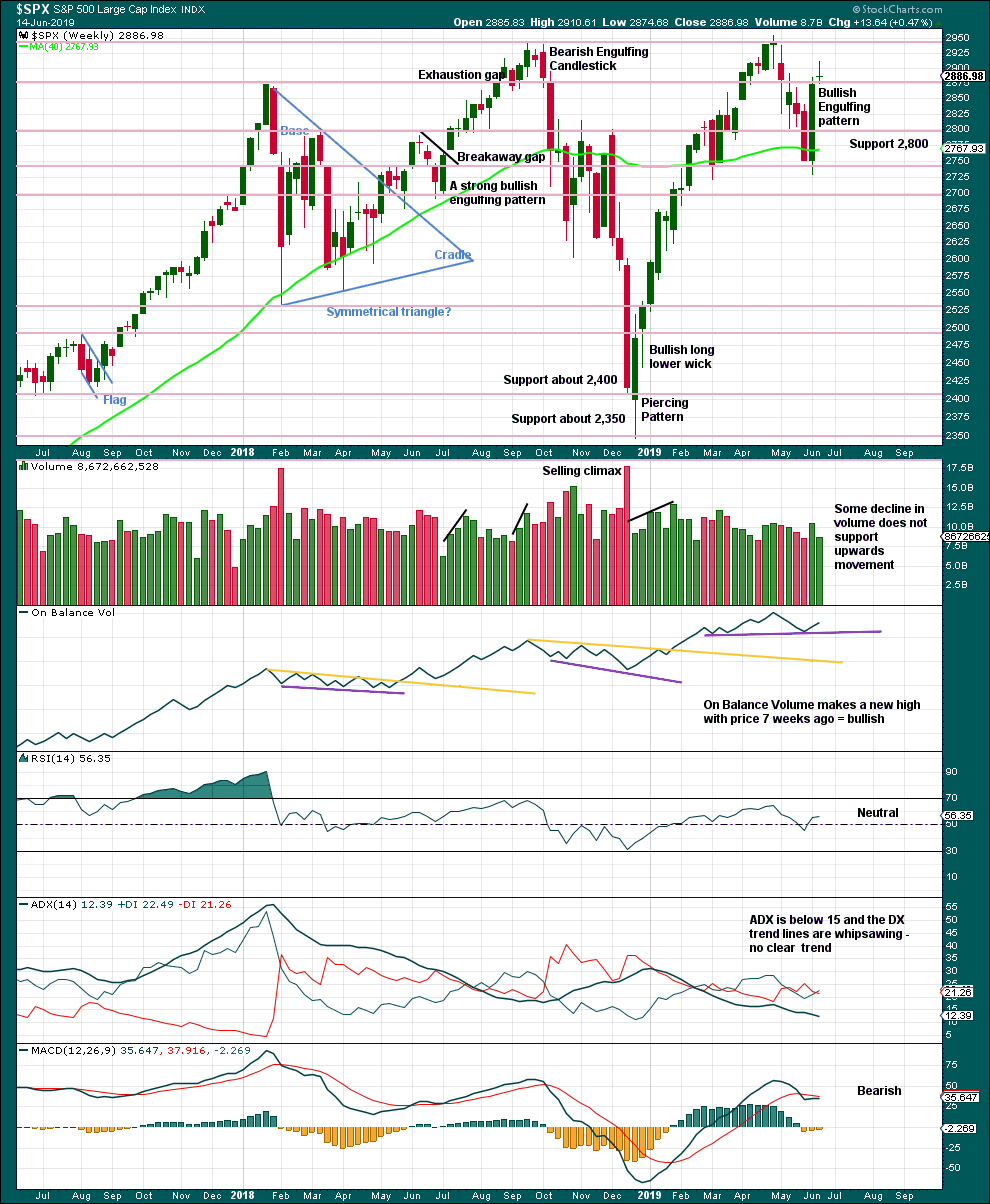
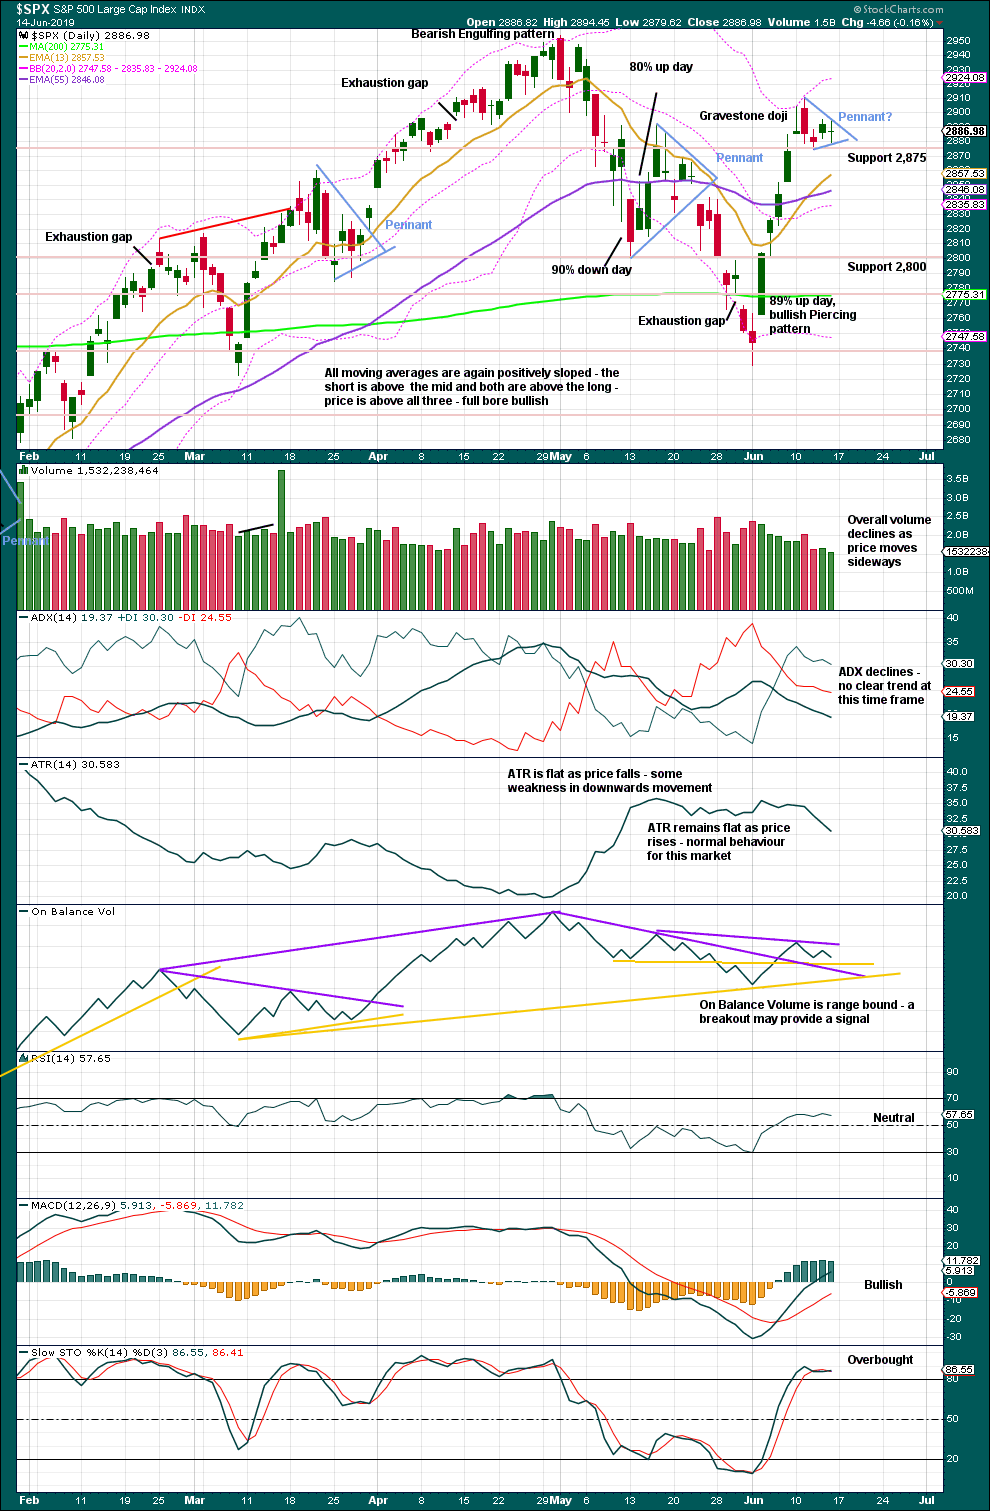
Weight will be given in this analysis to the strong bullish reversal pattern, which has support from volume. This supports the main Elliott wave counts.
The Doji candlestick this week represents indecision, a balance of bulls and bears. A Doji on its own is not a reversal signal; they can appear within trends as a small pause.
A new support line is drawn on On Balance Volume.
DAILY CHART
Click chart to enlarge. Chart courtesy of StockCharts.com.
A small pennant may be forming. The trend lines may need to be adjusted for it as it continues. Pennants are reliable continuation patterns. A target from the flag pole is about 3,072.
BREADTH – AD LINE
WEEKLY CHART
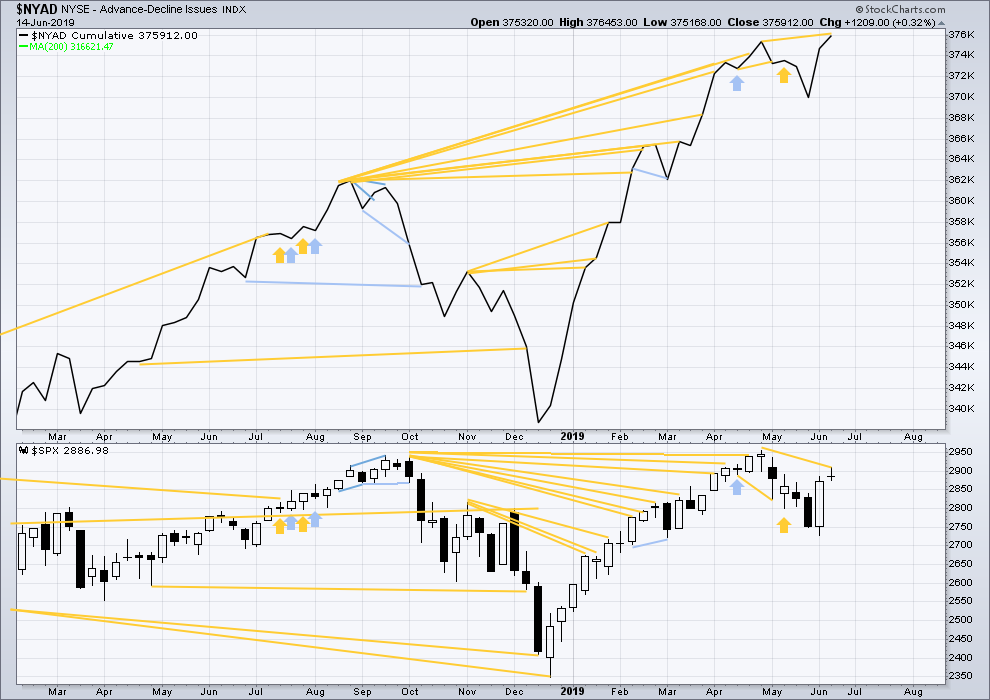
Click chart to enlarge. Chart courtesy of StockCharts.com. So that colour blind members are included, bearish signals
will be noted with blue and bullish signals with yellow.
Bear markets from the Great Depression and onwards have been preceded by an average minimum of 4 months divergence between price and the AD line with only two exceptions in 1946 and 1976. With the AD line making a new all time high this week, the end of this bull market and the start of a new bear market is very likely a minimum of 4 months away, which is mid October 2019.
In all bear markets in the last 90 years there is some positive correlation (0.6022) between the length of bearish divergence and the depth of the following bear market. No to little divergence is correlated with more shallow bear markets. Longer divergence is correlated with deeper bear markets.
If a bear market does develop here, it comes after no bearish divergence. It would therefore more likely be shallow.
This week the AD line makes a new all time high, but price has failed to make a corresponding new high. Breadth normally precedes price, so a new all time high from price in coming weeks looks most likely.
DAILY CHART
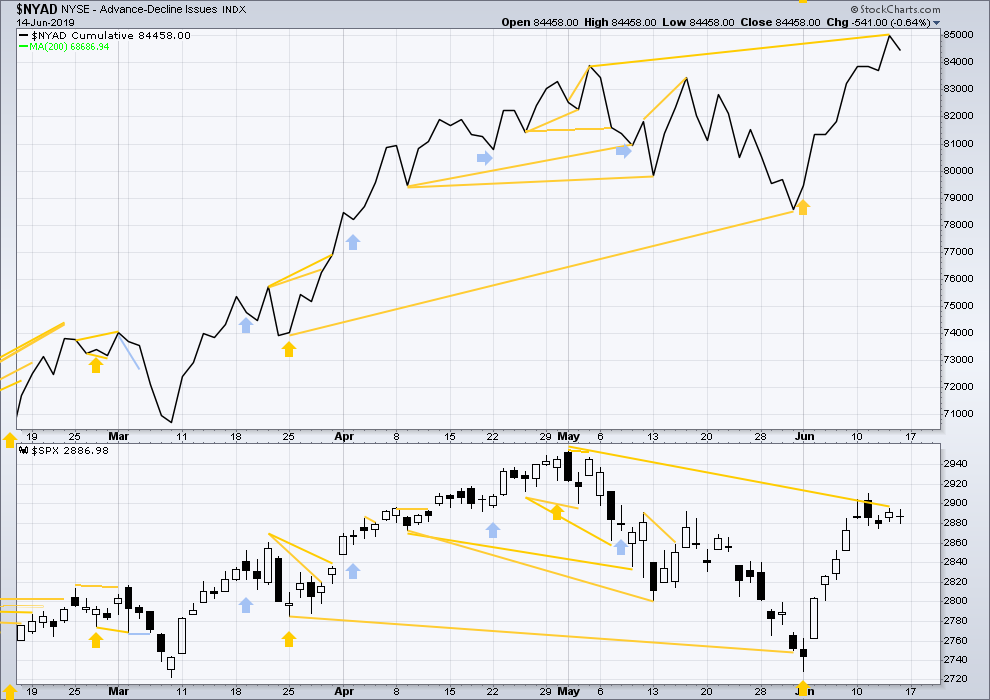
Click chart to enlarge. Chart courtesy of StockCharts.com. So that colour blind members are included, bearish signals
will be noted with blue and bullish signals with yellow.
Breadth should be read as a leading indicator.
Both price and the AD line moved a little lower on Friday. There is no new short-term divergence. Mid-term divergence remains bullish.
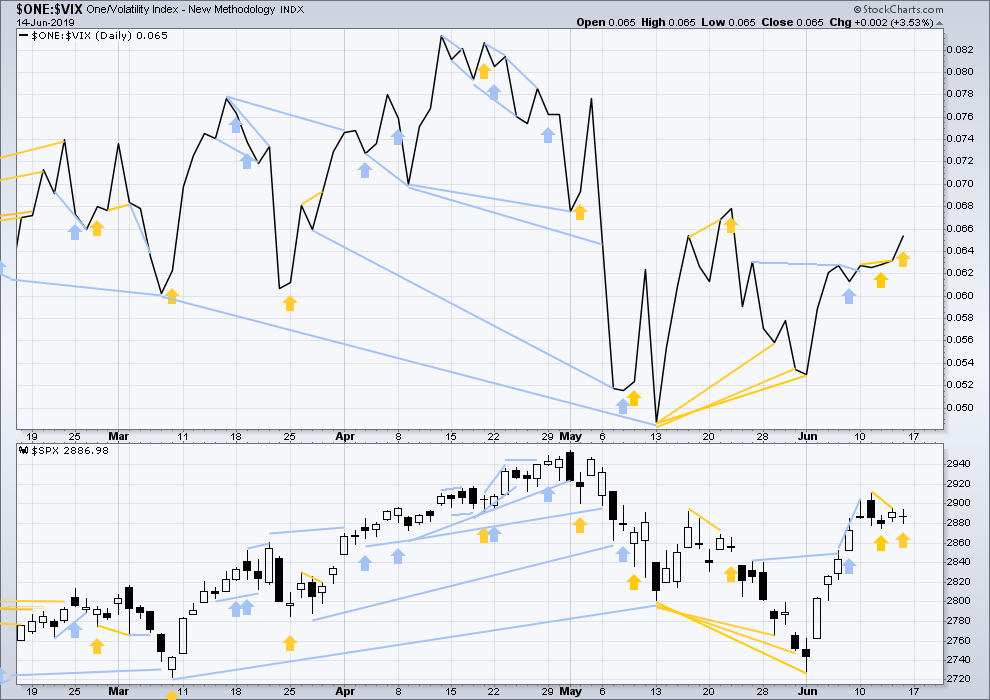
VOLATILITY – INVERTED VIX CHART
WEEKLY CHART
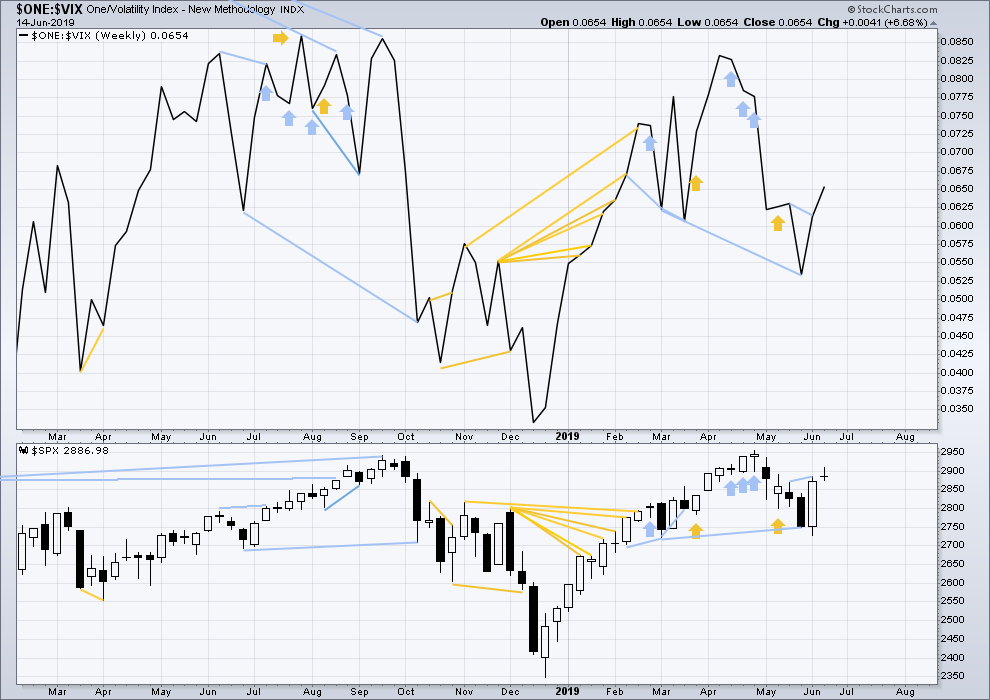
Click chart to enlarge. Chart courtesy of StockCharts.com. So that colour blind members are included, bearish signals
will be noted with blue and bullish signals with yellow.
Bearish divergence noted in last week’s analysis has not been followed by any downwards movement this week.
This week both price and inverted VIX have moved higher. There is no new short-term divergence.
Long-term bearish divergence remains.
DAILY CHART
Click chart to enlarge. Chart courtesy of StockCharts.com. So that colour blind members are included, bearish signals
will be noted with blue and bullish signals with yellow.
Price has moved lower for Friday, but inverted VIX has moved higher. This divergence is bullish for the short term.
DOW THEORY
Dow Theory confirmed a bear market in December 2018. This does not necessarily mean a bear market at Grand Super Cycle degree though; Dow Theory makes no comment on Elliott wave counts. On the 25th of August 2015 Dow Theory also confirmed a bear market. The Elliott wave count sees that as part of cycle wave II. After Dow Theory confirmation of a bear market in August 2015, price went on to make new all time highs and the bull market continued.
DJIA: 23,344.52 – a close on the 19th of December at 23,284.97 confirms a bear market.
DJT: 9,806.79 – price has closed below this point on the 13th of December.
S&P500: 2,532.69 – a close on the 19th of December at 2,506.96 provides support to a bear market conclusion.
Nasdaq: 6,630.67 – a close on the 19th of December at 6,618.86 provides support to a bear market conclusion.
With all the indices having moved higher following a Dow Theory bear market confirmation, Dow Theory would confirm a bull market if the following highs are made:
DJIA: 26,951.81
DJT: 11,623.58
S&P500: 2,940.91 – a new all time high has been made on the 29th of April 2019.
Nasdaq: 8,133.30 – a new high has been made on 24th of April 2019.
GOLD
The alternate Elliott wave count expected for the short term a new high to 1,349 before a reversal. Price reached 1,357.92, remaining below the Elliott wave invalidation point, and there sharply reversed.
Summary: A high may now be in place for Gold.
A new target is at 1,014. Thereafter, if price keeps falling, the next target is at 808. Along the way down, a new low below 1,160.75 would add strong confidence in the main Elliott wave count.
If price continues higher next week to make a new high reasonably above 1,365.68, then only the very bullish Elliott wave count would remain valid.
Grand SuperCycle analysis is here.
Last monthly charts are here. Video is here.
MAIN ELLIOTT WAVE COUNT
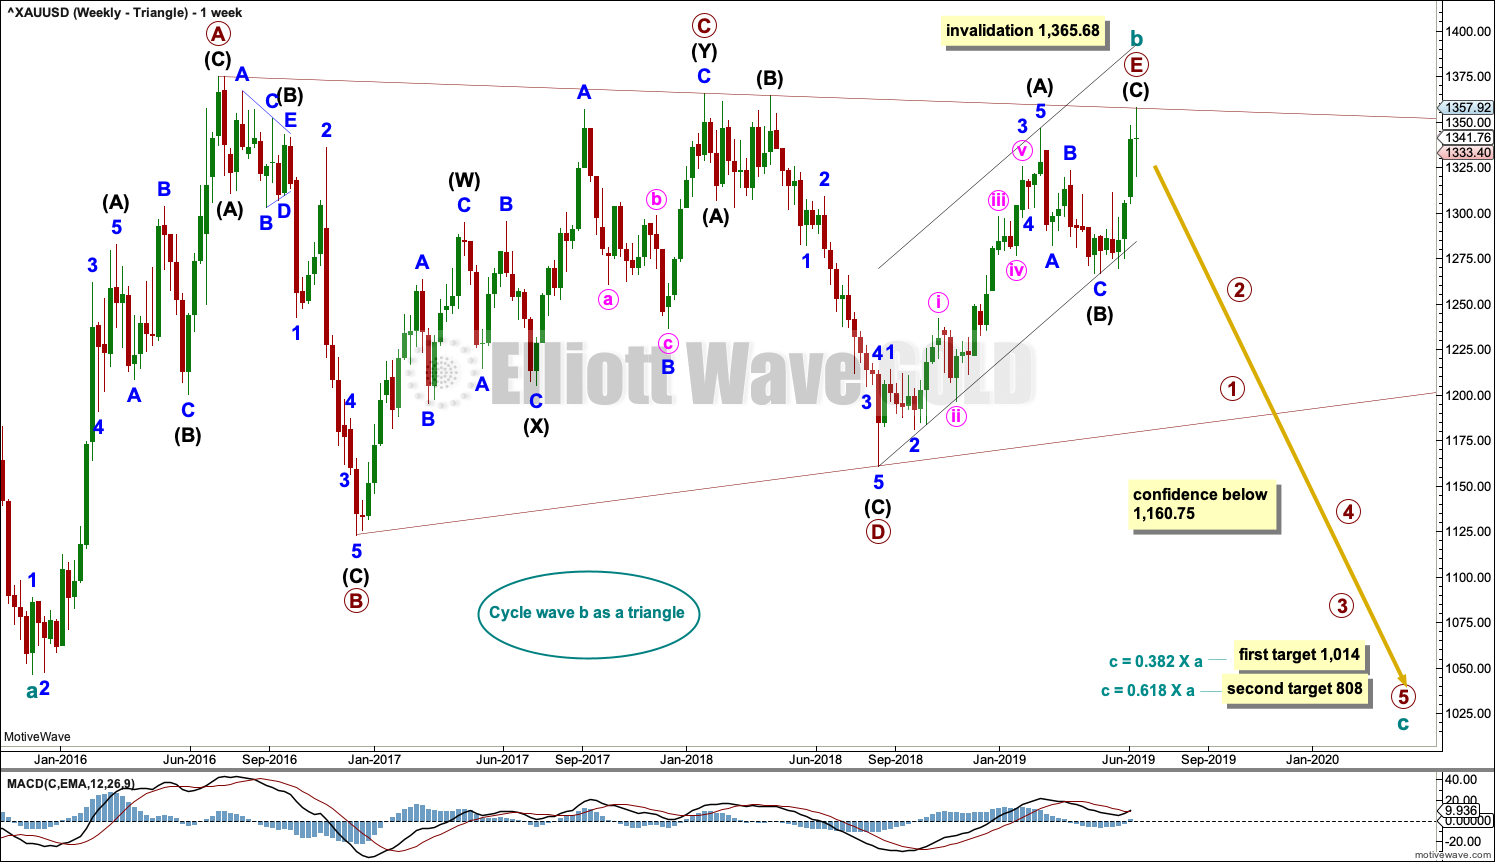
WEEKLY CHART – TRIANGLE
Click chart to enlarge.
The basic Elliott wave structure is five waves up followed by three waves back (in a bull market). At this time, the preferred Elliott wave count sees Gold as still within three waves back, which began at the all time high in September 2011.
Five waves up are labelled 1,2,3,4,5. Three waves back are labelled A,B,C.
This wave count sees Gold as now about two thirds through the three waves back. The three wave structure is labelled cycle waves a, b and c.
The triangle for cycle wave b may be complete. Primary wave E may have ended almost right at the A-C trend line. If it continues higher, then primary wave E may not move beyond the end of primary wave C above 1,365.68.
Draw a channel about the zigzag of primary wave E using Elliott’s technique. Draw the first trend line from the start of intermediate wave (A) to the end of intermediate wave (B), then place a parallel copy on the end of intermediate wave (A). A breach of the channel by downwards movement would be a strong indication that the triangle for cycle wave b is over and cycle wave c downwards may then be underway.
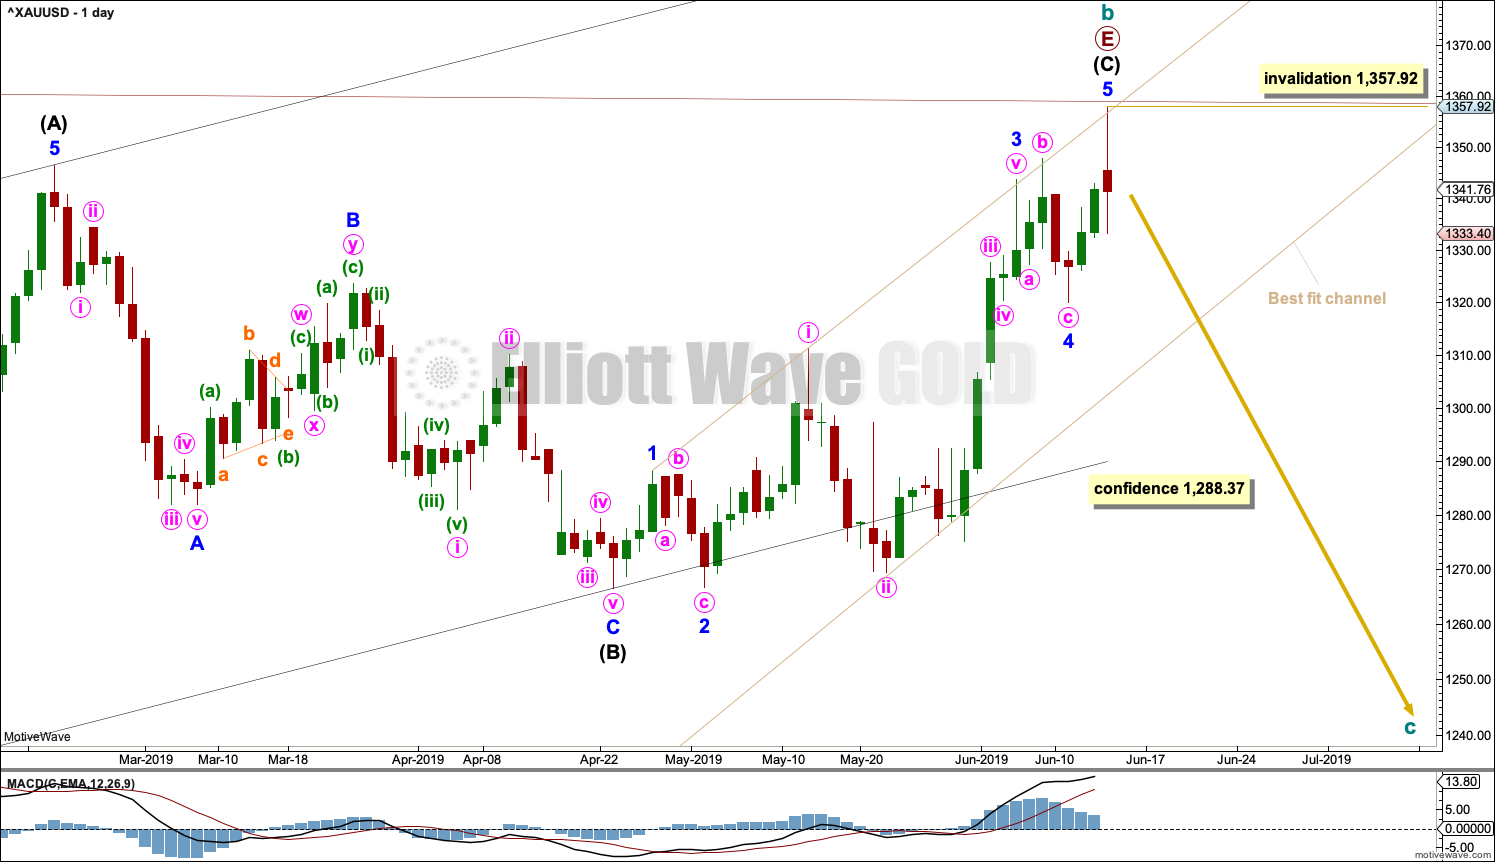
DAILY CHART – TRIANGLE
Click chart to enlarge.
Primary wave E must subdivide as a zigzag. Within the zigzag, intermediate wave (C) must subdivide as a five wave structure. Intermediate wave (C) may be over at this week’s high.
A best fit channel is drawn about the impulse of intermediate wave (C). A breach of this channel by downwards movement would be a strong indication that intermediate wave (C) should be over.
A new low now below 1,288.37 would add confidence in this wave count. At that stage, the alternate daily count below would be invalidated.
No second wave correction within a new trend at cycle degree may move beyond its start above 1,357.92.
Within intermediate wave (C), there is no Fibonacci ratio between minor waves 1 and 3, and minor wave 5 is just 2.66 longer than 1.618 the length of minor wave 1.
When triangles complete for Gold, the resulting movement out of them usually begins with some strength.
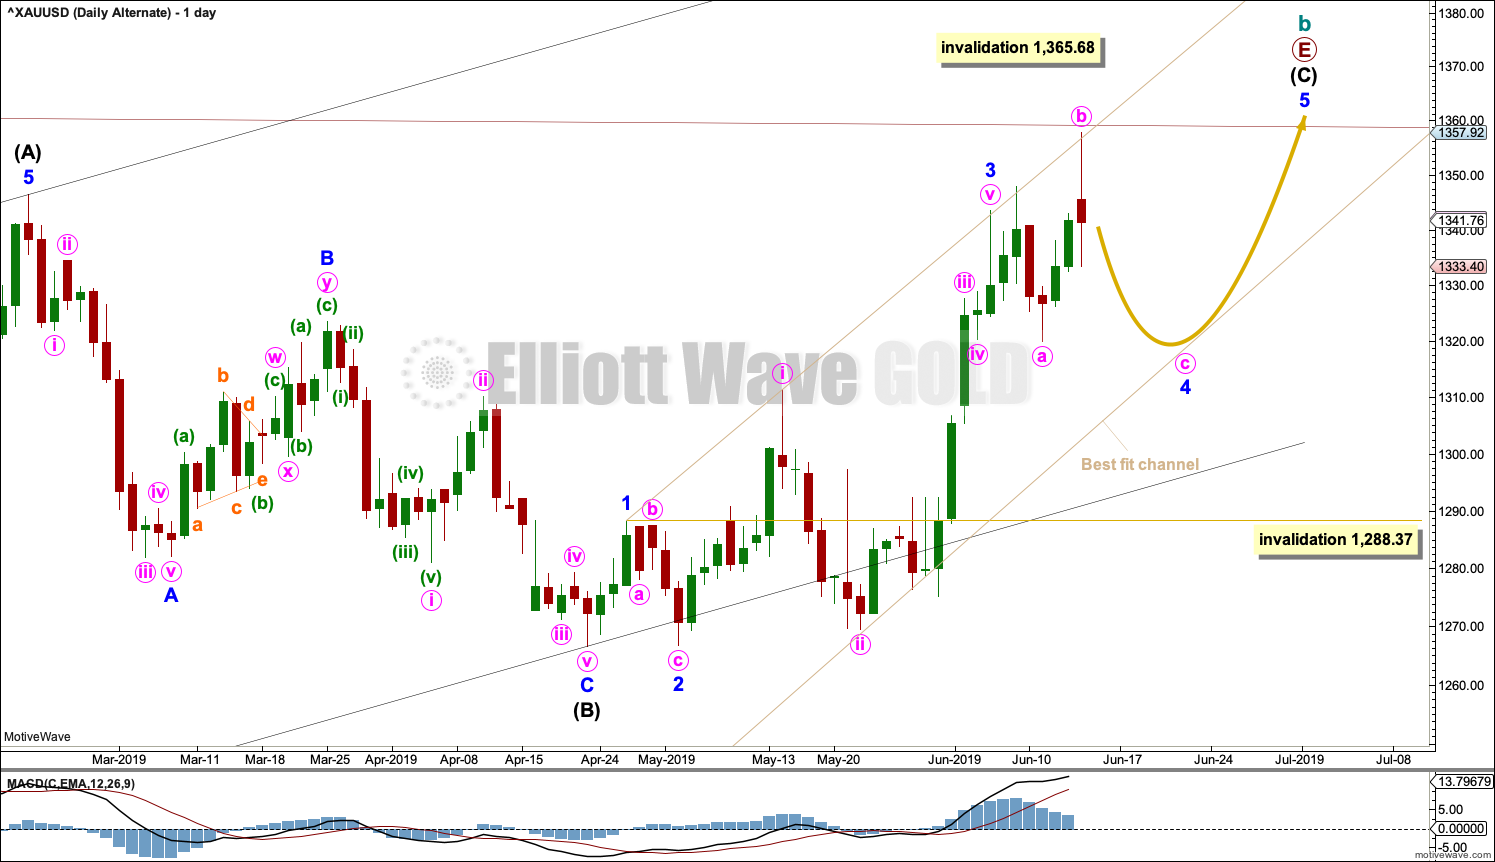
DAILY CHART – TRIANGLE – ALTERNATE
Click chart to enlarge.
It is also possible that minor wave 4 may be incomplete and may be continuing as an expanded flat or double flat.
This alternate wave count expects to see sideways movement for another week to two, and thereafter a new high above 1,357.92 but not above 1,365.68. This alternate wave count this week does not have good support from technical analysis.
Minor wave 4 may not move into minor wave 1 price territory below 1,288.37.
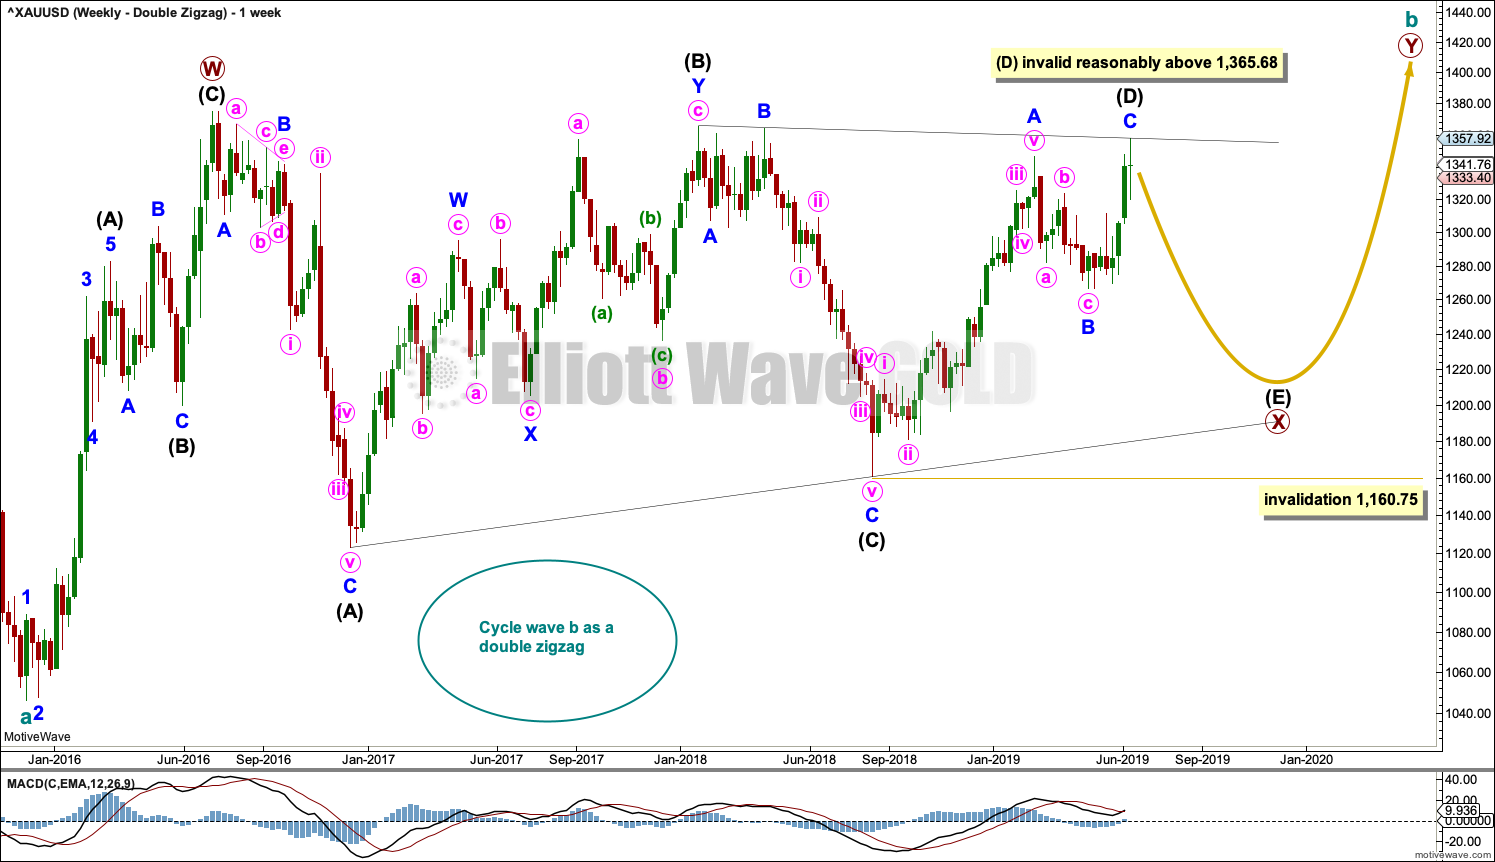
WEEKLY CHART – DOUBLE ZIGZAG
Click chart to enlarge.
This wave count is identical to the first weekly chart up to the low labelled cycle wave a. Thereafter, a different Elliott wave corrective structure is considered for cycle wave b.
It is possible that cycle wave b may be an incomplete double zigzag or a double combination.
The first zigzag in the double is labelled primary wave W. This has a good fit.
The double may be joined by a corrective structure in the opposite direction, a triangle labelled primary wave X. The triangle may be incomplete.
Within multiples, X waves are almost always zigzags and rarely triangles. Within the possible triangle of primary wave X, it is intermediate wave (B) that is a multiple; this is acceptable, but note this is not the most common triangle sub-wave to subdivide as a multiple. These two points reduce the probability of this wave count in terms of Elliott wave.
It is possible that intermediate wave (D) may be complete.
If it continues higher, then intermediate wave (D) of a contracting triangle may not move beyond the end of intermediate wave (B) above 1,365.68.
Intermediate wave (D) of a barrier triangle may end about the same level as intermediate wave (B); as long as the (B)-(D) trend line remains essentially flat the triangle will remain valid. This is the only Elliott wave rule that is not black and white. In practice, intermediate wave (D) may end slightly above intermediate wave (B) at 1,365.68 and this wave count would remain valid. If intermediate wave (D) is now complete, then the (B)-(D) trend line now sits perfectly across the high of minor wave B within intermediate wave (C).
Primary wave Y would most likely be a zigzag because primary wave X would be shallow; double zigzags normally have relatively shallow X waves.
Primary wave Y may also be a flat correction if cycle wave b is a double combination, but combinations normally have deep X waves. This would be less likely.
This wave count has good proportions and no problems in terms of subdivisions.
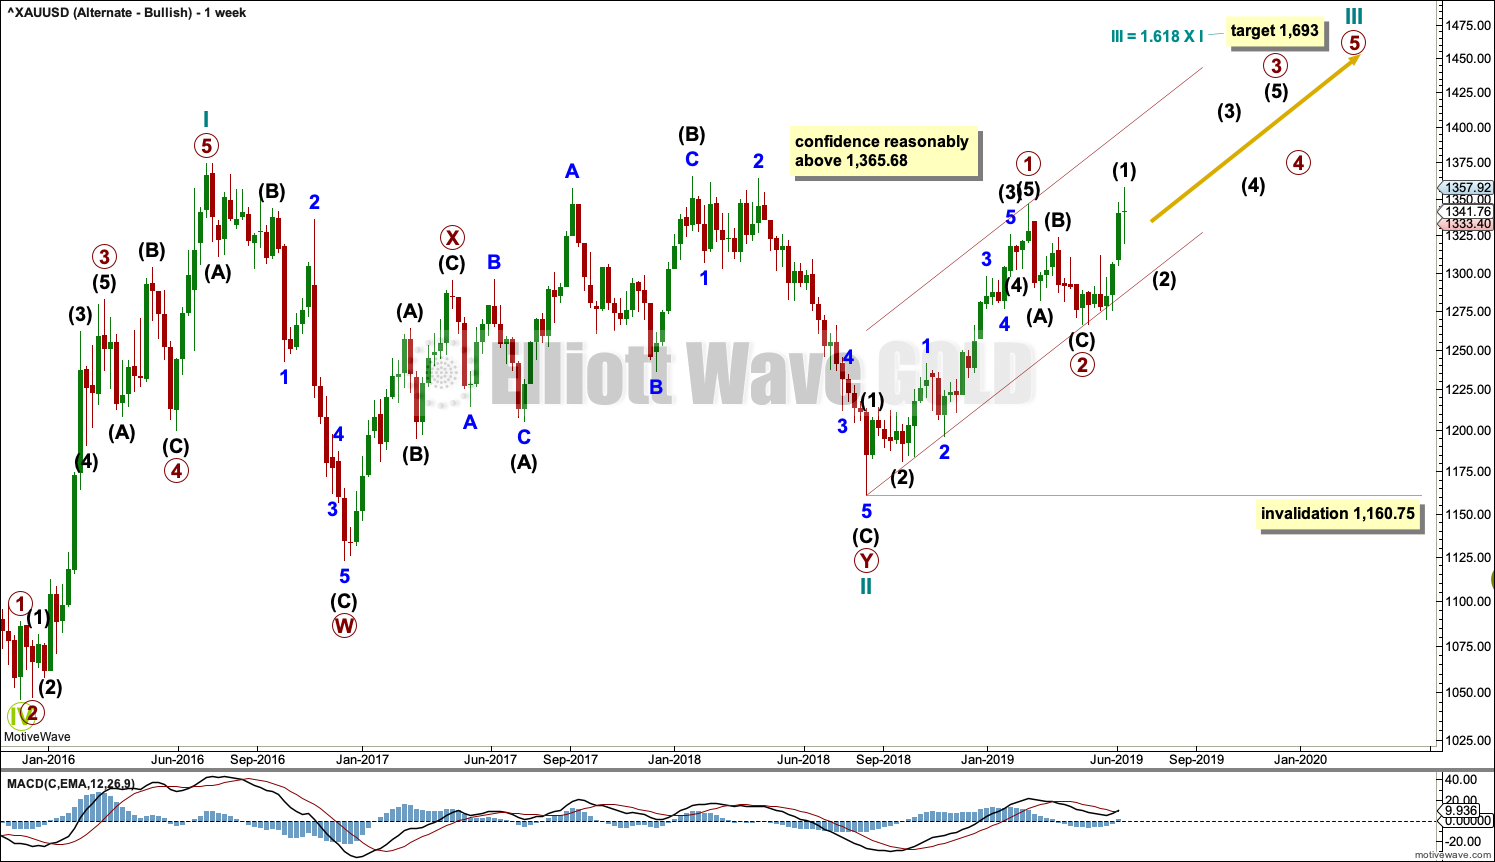
ALTERNATE ELLIOTT WAVE COUNT
WEEKLY CHART
Click chart to enlarge.
This wave count sees the three waves back now complete at the last major low for Gold in November 2019.
If Gold is in a new bull market, then it should begin with a five wave structure upwards on the weekly chart. However, the biggest problem with this wave count is the structure labelled cycle wave I because this wave count must see it as a five wave structure, but it looks more like a three wave structure.
Commodities often exhibit swift strong fifth waves that force the fourth wave corrections coming just prior and just after to be more brief and shallow than their counterpart second waves. It is unusual for a commodity to exhibit a quick second wave and a more time consuming fourth wave, and this is how cycle wave I is labelled. The probability of this wave count is low due to this problem.
Cycle wave II subdivides well as a double combination: zigzag – X – expanded flat.
Cycle wave III may have begun. Within cycle wave III, primary waves 1 and 2 may now be complete. If it continues lower as a double zigzag, then primary wave 2 may not move beyond the start of primary wave 1 below 1,160.75.
Cycle wave III so far for this wave count would have been underway now for 43 weeks. It may be beginning to exhibit some support from volume and increasing ATR. If this increase continues, then this wave count would have some support from technical analysis.
There is very strong resistance here in a zone from 1,345 to 1,375. This wave count now expects an upwards breakout above 1,375, which should have support from volume. While an upwards breakout has not happened, this wave count will continue to have a low probability.
TECHNICAL ANALYSIS
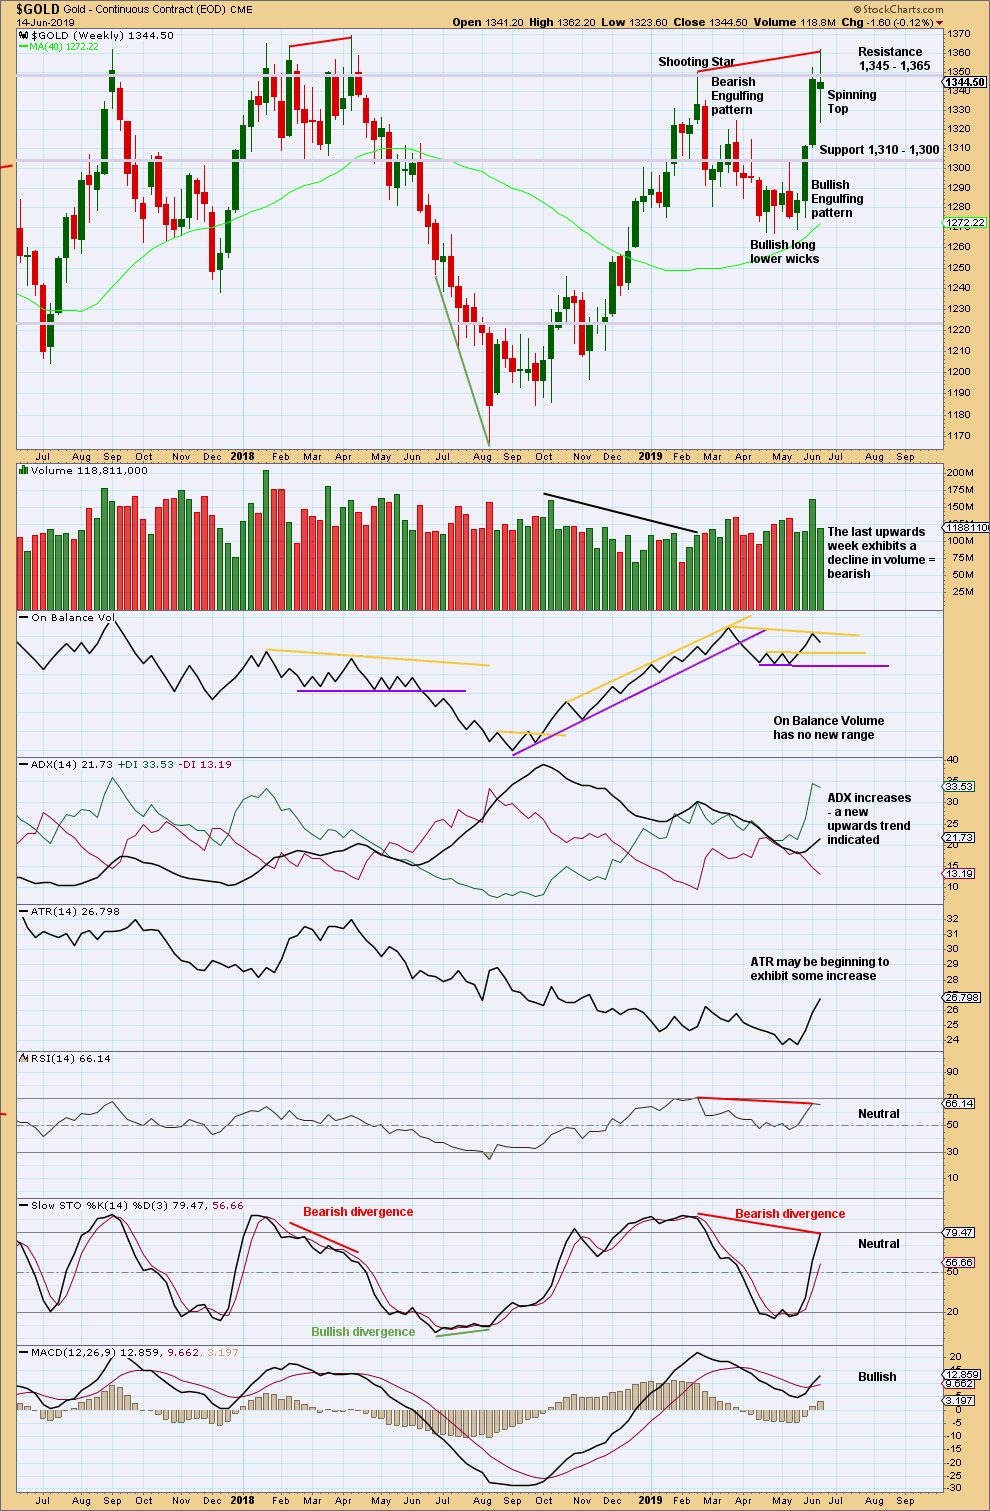
WEEKLY CHART
Click chart to enlarge. Chart courtesy of StockCharts.com.
At the last few major highs for Gold (on weeks of 5th July 2016, 5th September 2017, 9th April 2018 and 19th February 2019) the following points are noted:
– Volume was not the strongest for the last upwards week. Some decline in volume accompanied the final high.
– Bearish divergence was seen between price and Stochastics in only two of four of the identified major highs.
– Bearish divergence was seen between price and RSI in only one of four of the identified major highs.
This week there is bearish divergence between price and Stochastics, and price and RSI after RSI reached overbought. There is also now a final upwards week that exhibits a strong decline in volume. This week it looks like there is more likely to be a high in place.
The Spinning Top candlestick pattern on its own is not a reversal signal. It is neutral and represents indecision.
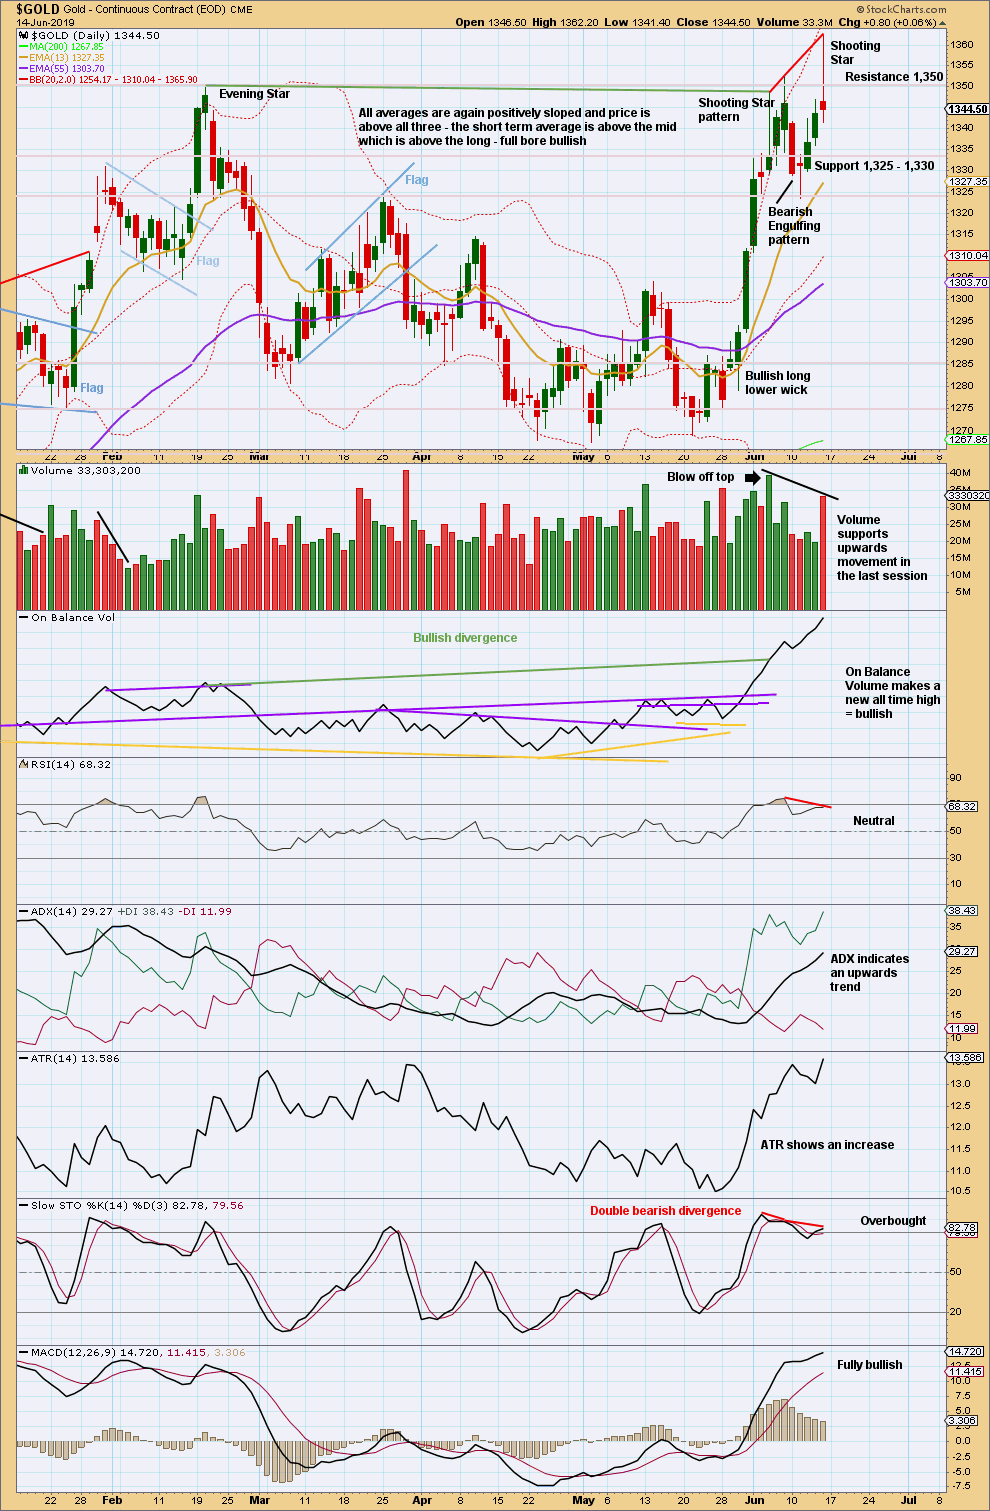
DAILY CHART
Click chart to enlarge. Chart courtesy of StockCharts.com.
There is now another bearish candlestick reversal pattern. In conjunction with bearish divergence between price and both of Stochastics and RSI, after both reached overbought, it looks more likely now that a high may be in place.
Although volume supports upwards movement within the last session, the candlestick closed red. Volume shows some decline from the prior strong upwards day of the 5th of June.
GDX WEEKLY CHART
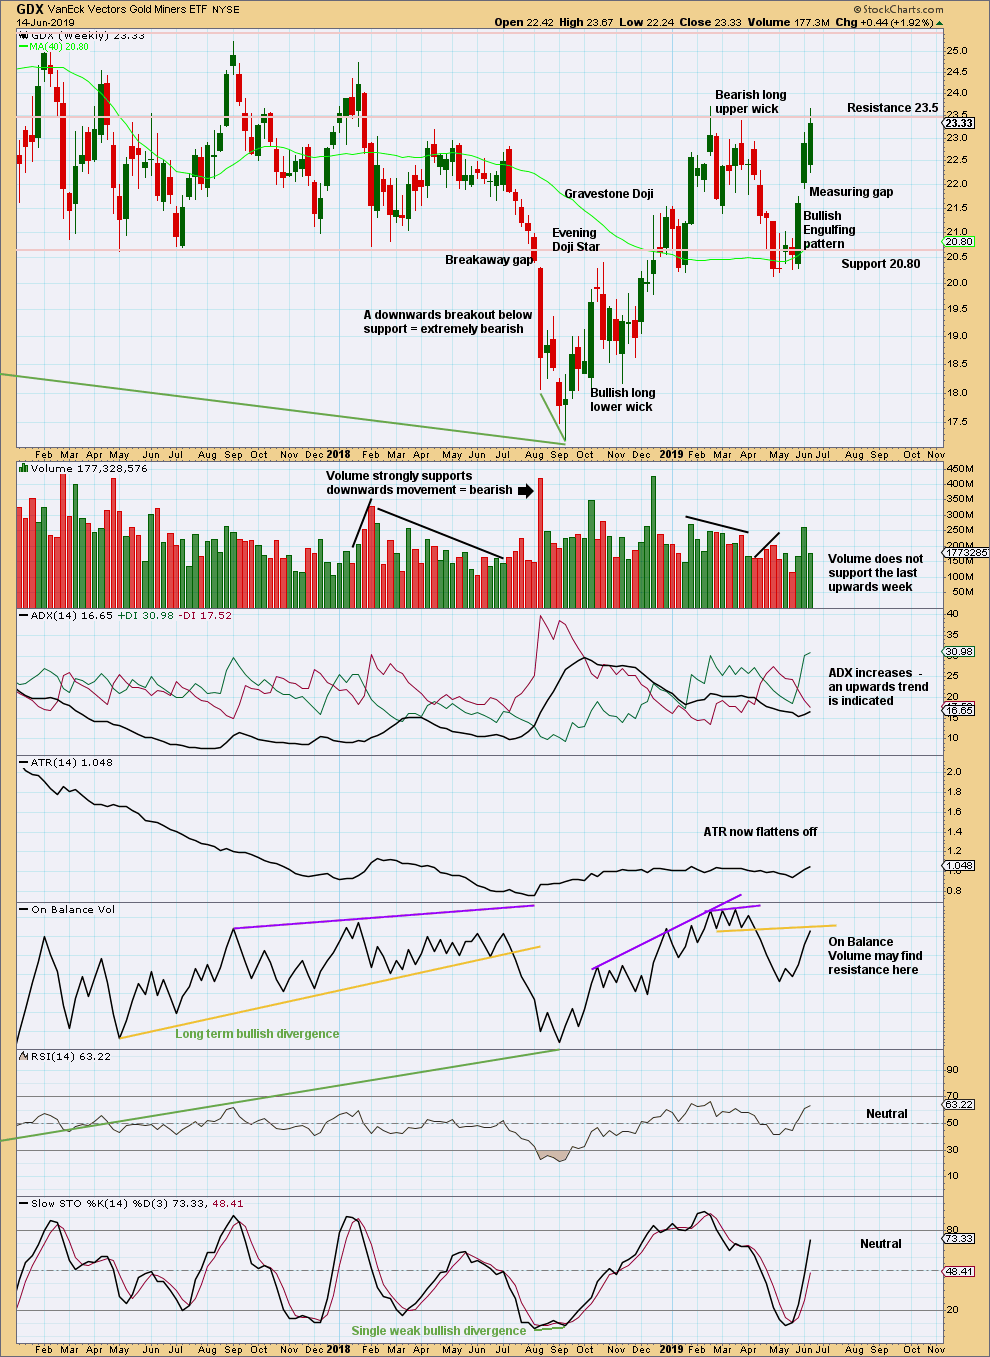
Click chart to enlarge. Chart courtesy of StockCharts.com.
Some decline in volume this week is slightly bearish, but not enough for expect a high here for GDX. Assume an upwards trend remains until proven otherwise.
GDX DAILY CHART
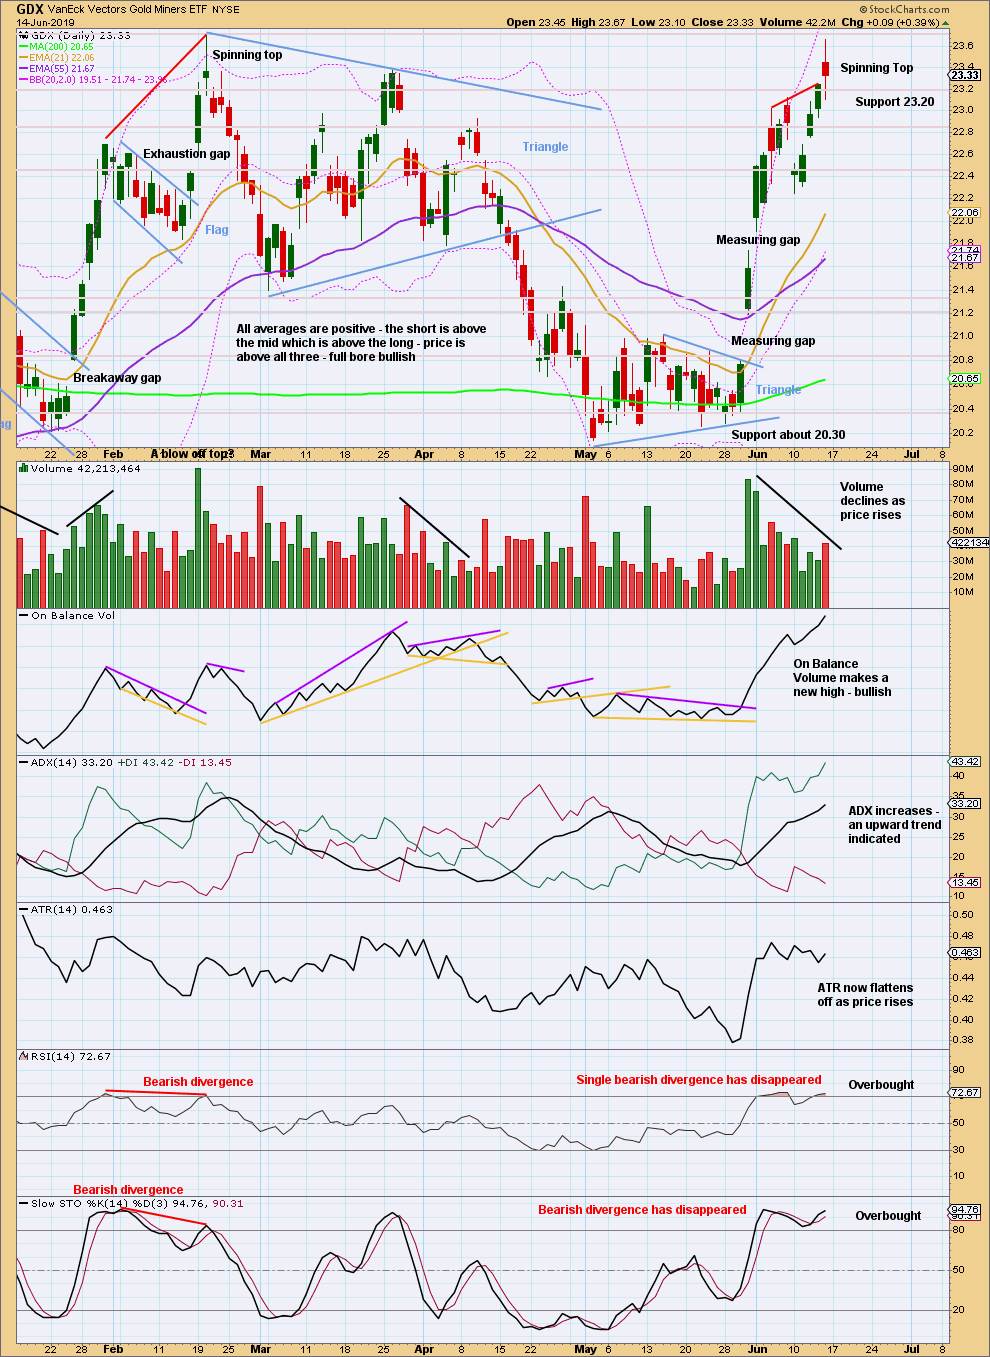
Click chart to enlarge. Chart courtesy of StockCharts.com.
The last measuring gap may now provide support. It may remain open at 21.74.
With bearish divergence between price and both of RSI and Stochastics now almost disappeared, the warning that the upwards trend may be over is now much dulled.
An upwards trend is in place. Assume it will continue until proven otherwise. Today there is no evidence of a trend change for GDX.
US OIL
A relatively shallow bounce was expected to continue this week. A slightly higher high and a slightly higher low overall fits this expectation.
Summary: A sideways consolidation for a fourth wave may continue next week. It may find resistance about the upper edge of the Elliott channel. The bounce should not move above 60.04.
If price does come up to touch the upper edge of the channel, that may be used as an entry opportunity to join the downwards trend.
When this bounce or consolidation is complete, then a target may be calculated for the fifth wave down to end. That cannot be done yet.
The final target is now calculated at 10.72.
MAIN ELLIOTT WAVE COUNT
MONTHLY CHART
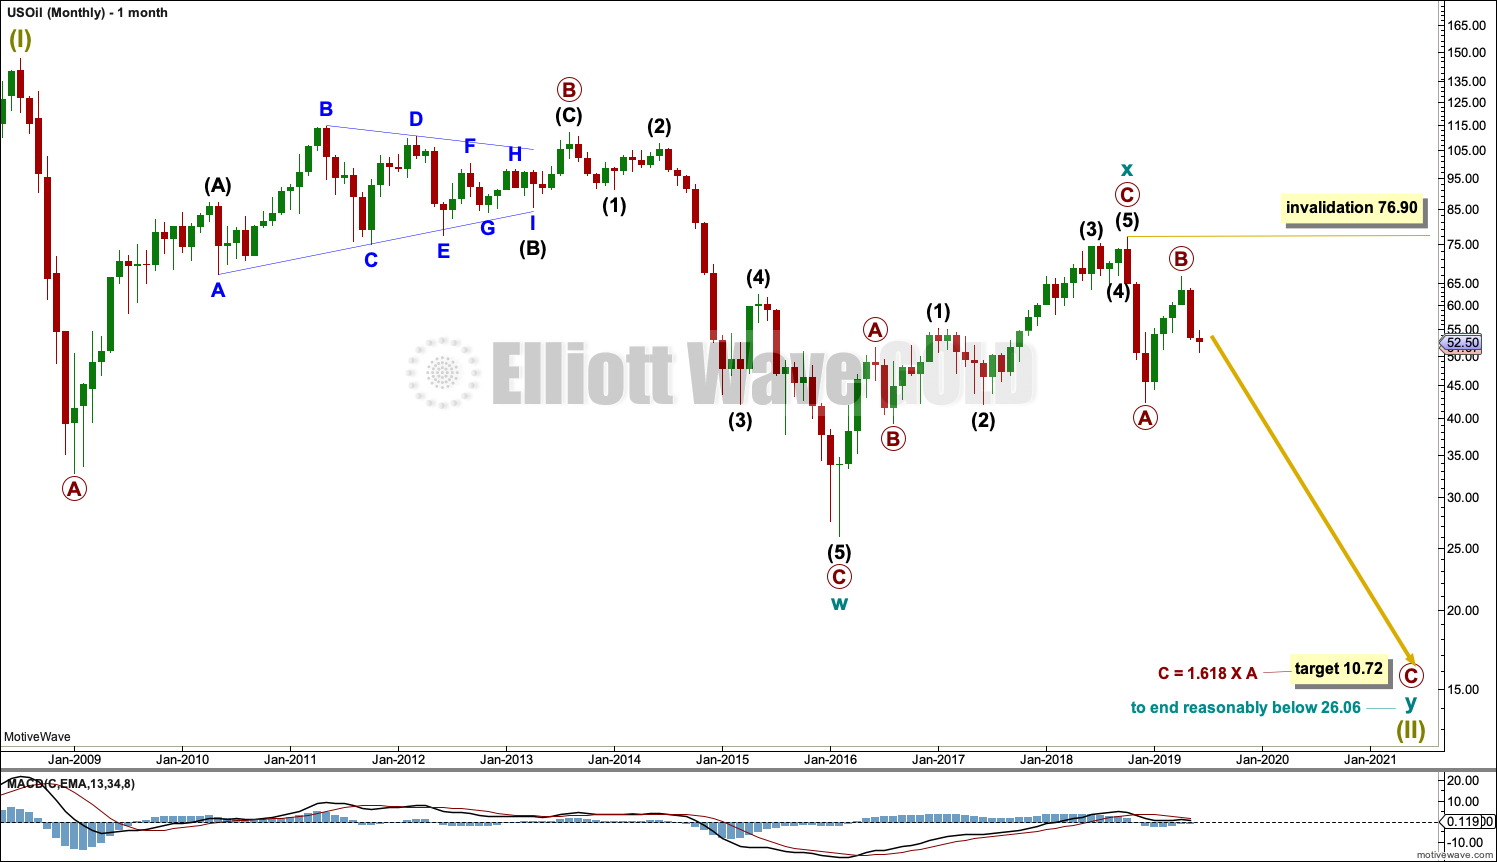
Click chart to enlarge.
The basic Elliott wave structure is five steps forward and three steps back. This Elliott wave count expects that US Oil is still within a three steps back pattern, which began in July 2008. The Elliott wave count expects that the bear market for US Oil continues.
This Elliott wave corrective structure is a double zigzag, which is a fairly common structure. The correction is labelled Super Cycle wave (II).
The first zigzag in the double is complete and labelled cycle wave y. The double is joined by a three in the opposite direction labelled cycle wave x, which subdivides as a zigzag. The second zigzag in the double may now have begun, labelled cycle wave w.
The purpose of a second zigzag in a double zigzag is to deepen the correction when the first zigzag does not move price deep enough. To achieve this purpose cycle wave y may be expected to move reasonably below the end of cycle wave w at 26.06. The target calculated would see this expectation met.
Cycle wave y is expected to subdivide as a zigzag, which subdivides 5-3-5.
Cycle wave w lasted 7.6 years and cycle wave x lasted 2.7 years. Cycle wave y may be expected to last possibly about a Fibonacci 5 or 8 years.
If it continues higher, then primary wave B may not move beyond the start of primary wave A above 76.90.
WEEKLY CHART
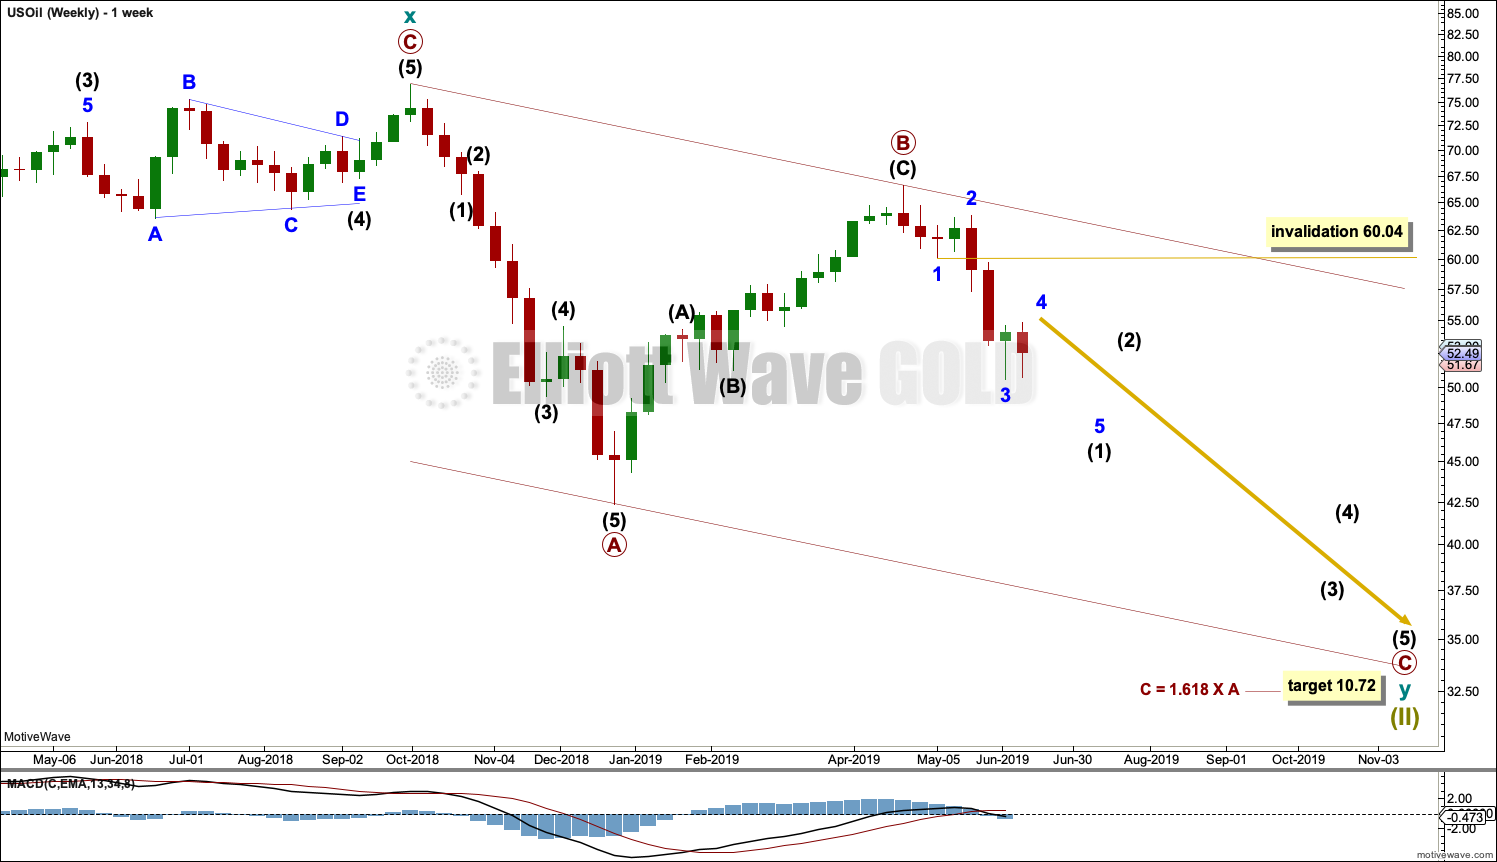
Click chart to enlarge.
This weekly chart is focussed on the start of cycle wave y.
Cycle wave y is expected to subdivide as a zigzag. A zigzag subdivides 5-3-5. Primary wave A must subdivide as a five wave structure if this wave count is correct.
Primary wave A may be a complete five wave impulse at the last low.
Primary wave B may now be a complete single zigzag at the last high.
Primary wave C may have just begun. Primary wave C must subdivide as a five wave structure.
Primary wave A lasted 12 weeks, just one short of a Fibonacci 13.
Primary wave C may be longer in time as well as price. If cycle wave y lasts a Fibonacci 5 years, then primary wave C within it may take as long as a Fibonacci 233 weeks.
Intermediate wave (1) within primary wave C may be subdividing as an impulse. Within the impulse, minor wave 4 may not move into minor wave 1 price territory above 60.04.
Draw a channel about the zigzag of primary wave y using Elliott’s technique for a correction. Draw the first trend line from the start of primary wave A to the end of primary wave B, then place a parallel copy on the end of primary wave A. The upper edge of this channel may show where bounces along the way down find resistance. The lower edge of the channel may provide support.
When intermediate wave (1) is complete, then a bounce for intermediate wave (2) may be a multi-week bounce that may find resistance at the upper edge of the Elliott channel.
DAILY CHART
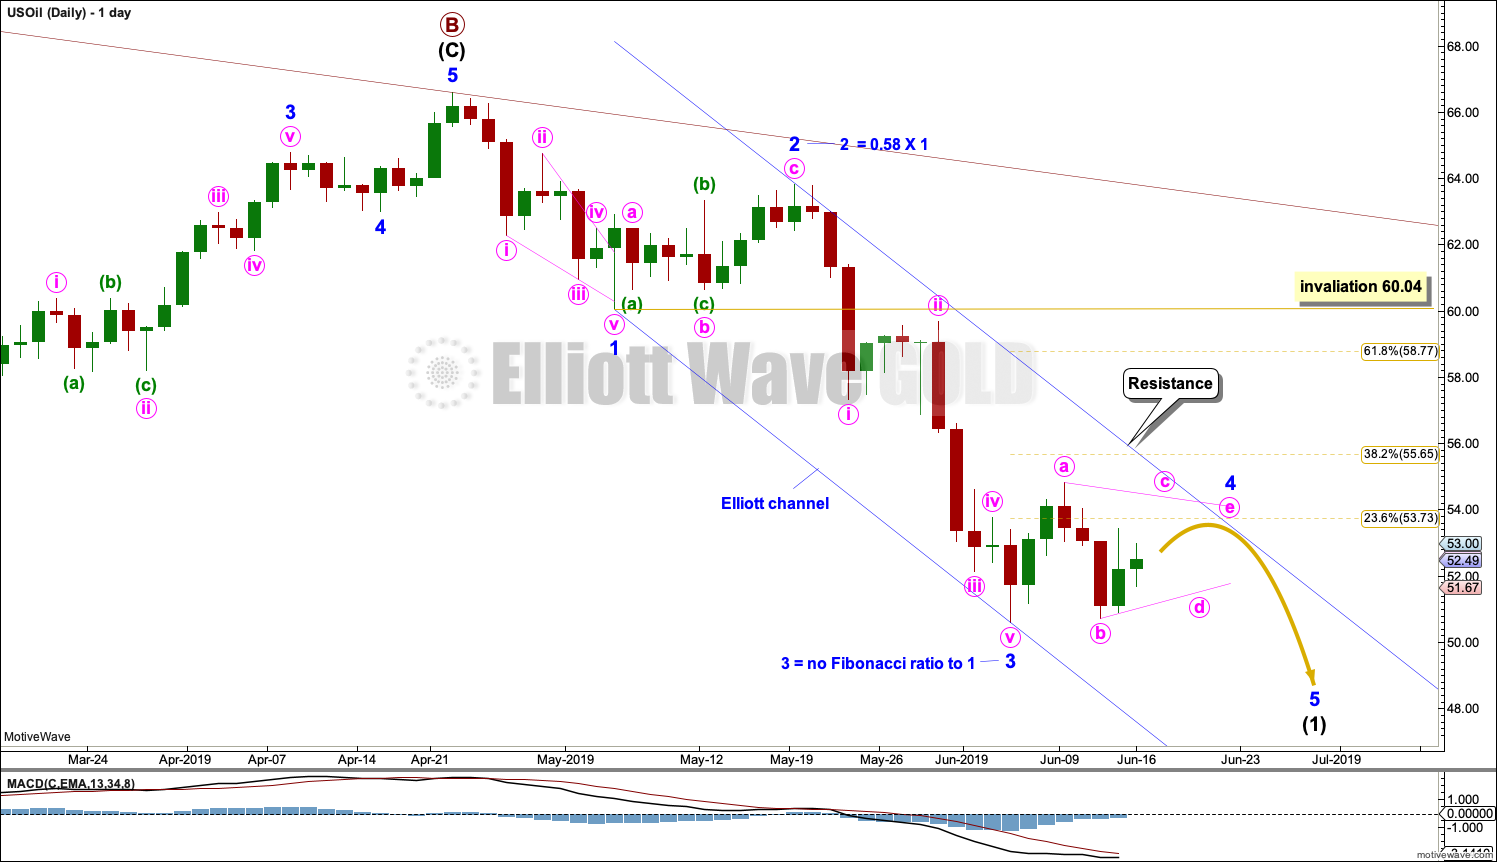
Click chart to enlarge.
Note that monthly and weekly charts are on a semi-log scale, but this daily chart is on an arithmetic scale. This makes a slight difference to trend channels.
The daily chart focusses on the structure of intermediate wave (1) within primary wave C.
Intermediate wave (1) may be unfolding as an impulse. Within intermediate wave (1), minor waves 1 through to 3 may be complete. Minor wave 3 shows an increase in downwards momentum beyond that of minor wave 1. This wave count fits with MACD.
Minor wave 2 was a relatively deep zigzag lasting 10 sessions. Minor wave 4 may exhibit alternation as a shallow flat, combination or triangle. Minor wave 4 may last about two weeks, or it may be longer lasting as sideways corrections do tend to be longer lasting than zigzags.
This week minor wave 4 is labelled as a possible regular contracting triangle, which is the most common Elliott wave triangle. However, as minor wave 4 continues sideways this labelling may change; it may be relabelled as a flat or combination.
Minor wave 4 may find resistance about the upper edge of the blue Elliott channel. Draw this channel with the first trend line from the ends of minor waves 1 to 3, then place a parallel copy on the end of minor wave 2.
Minor wave 3 did not exhibit a Fibonacci ratio to minor wave 1. Minor wave 5 would be likely to exhibit a Fibonacci ratio to either of minor waves 1 or 3, with equality in length with minor wave 1 at $6.55 the most likely. When minor wave 4 is complete and the start of minor wave 5 is know, then the Fibonacci ratio may be applied to calculate a target for minor wave 5 to end. That cannot be done yet.
DAILY CHART ALTERNATE
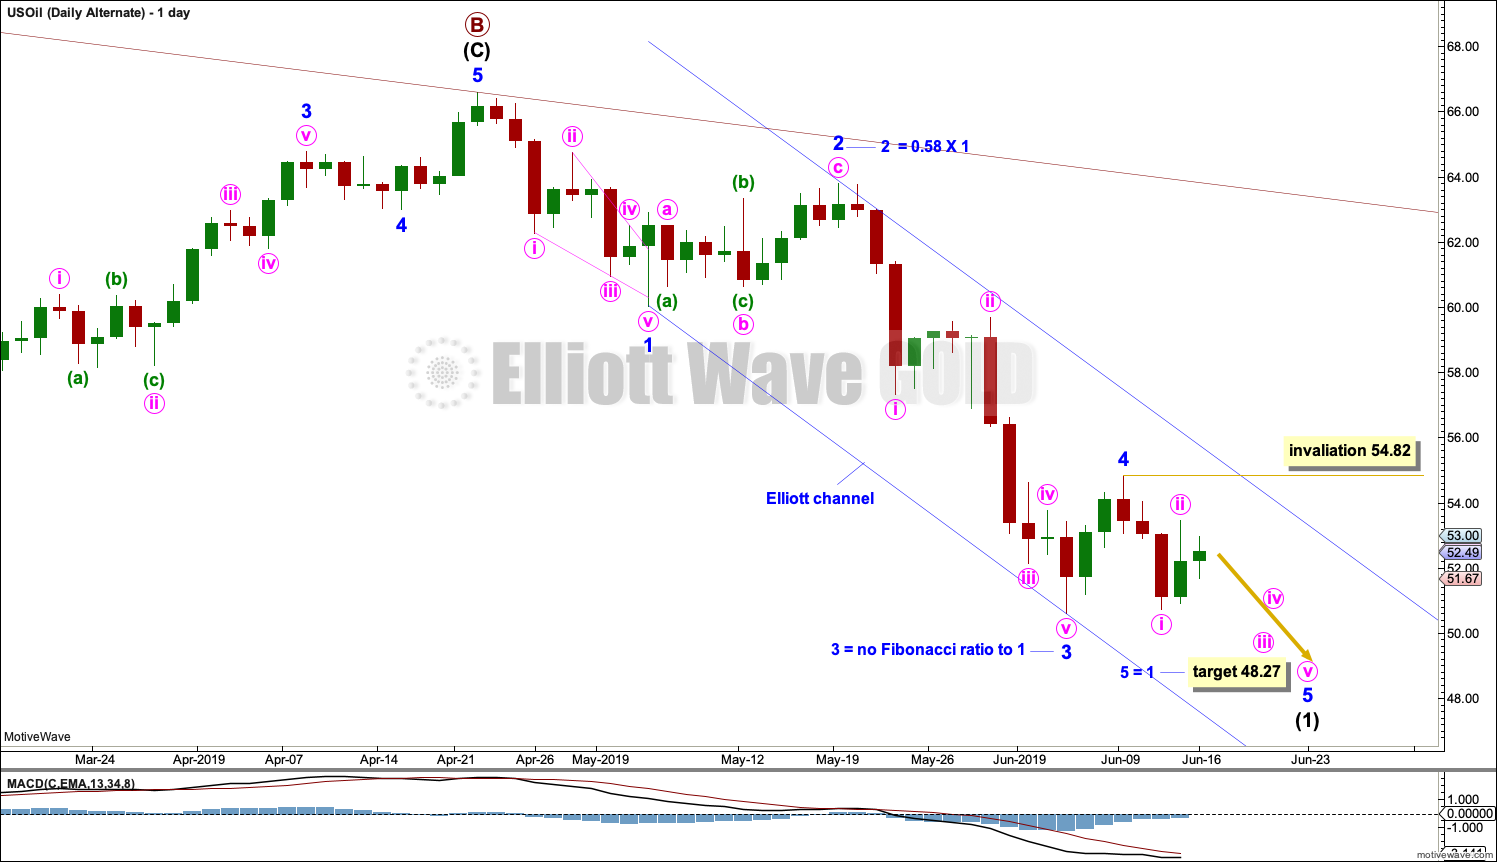
Click chart to enlarge.
It is possible that minor wave 4 may be a relatively brief and shallow zigzag. The proportion between minor waves 2 and 4 for this wave count is not very good. This reduces the probability, so it is labelled as an alternate.
A target is calculated for minor wave 5 to end. Within minor wave 5, minute wave ii may not move beyond the start of minute wave i above 54.82.
For confidence this wave count requires a downwards breakout that should show some strength either with increased volume, ATR or very strong momentum.
TECHNICAL ANALYSIS
MONTHLY CHART
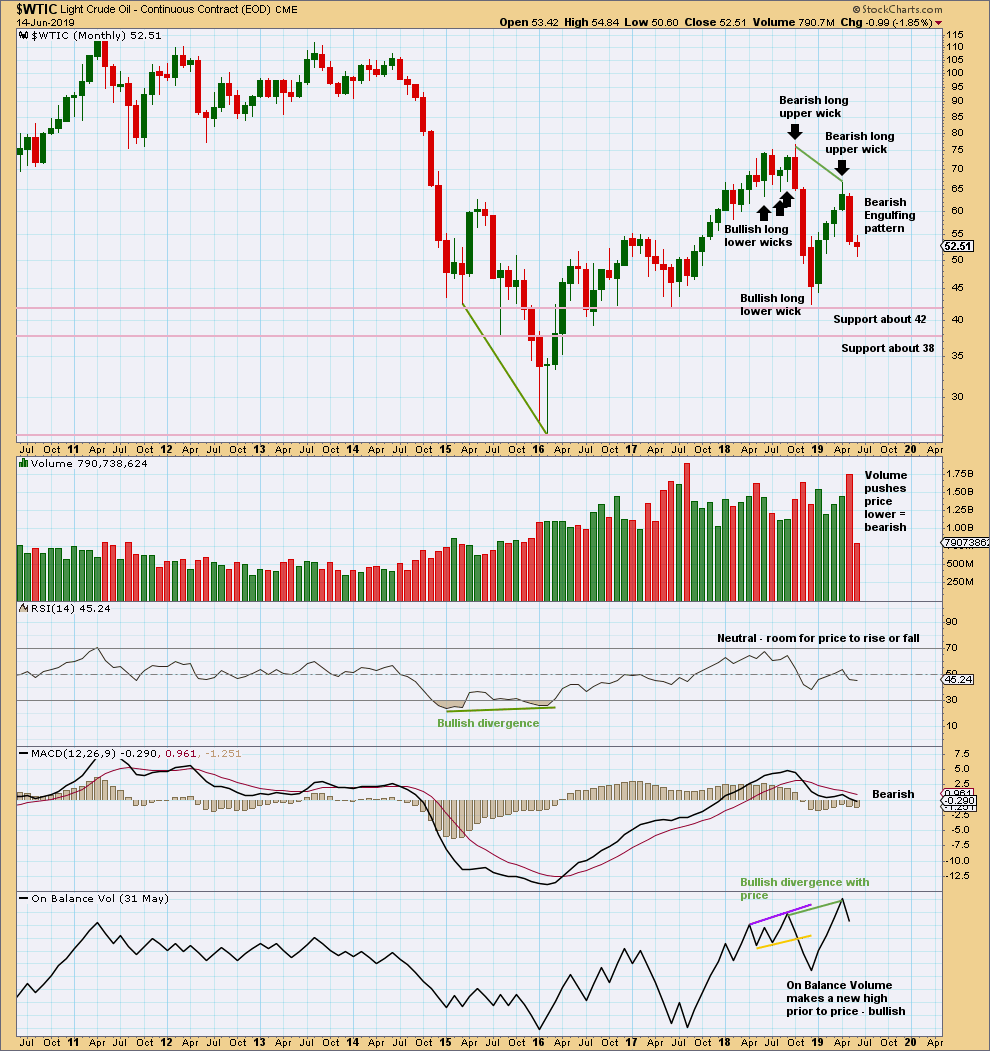
Click chart to enlarge. Chart courtesy of StockCharts.com.
May has closed with a strong Bearish Engulfing candlestick pattern, which has strong support from volume. This supports the Elliott wave count.
WEEKLY CHART
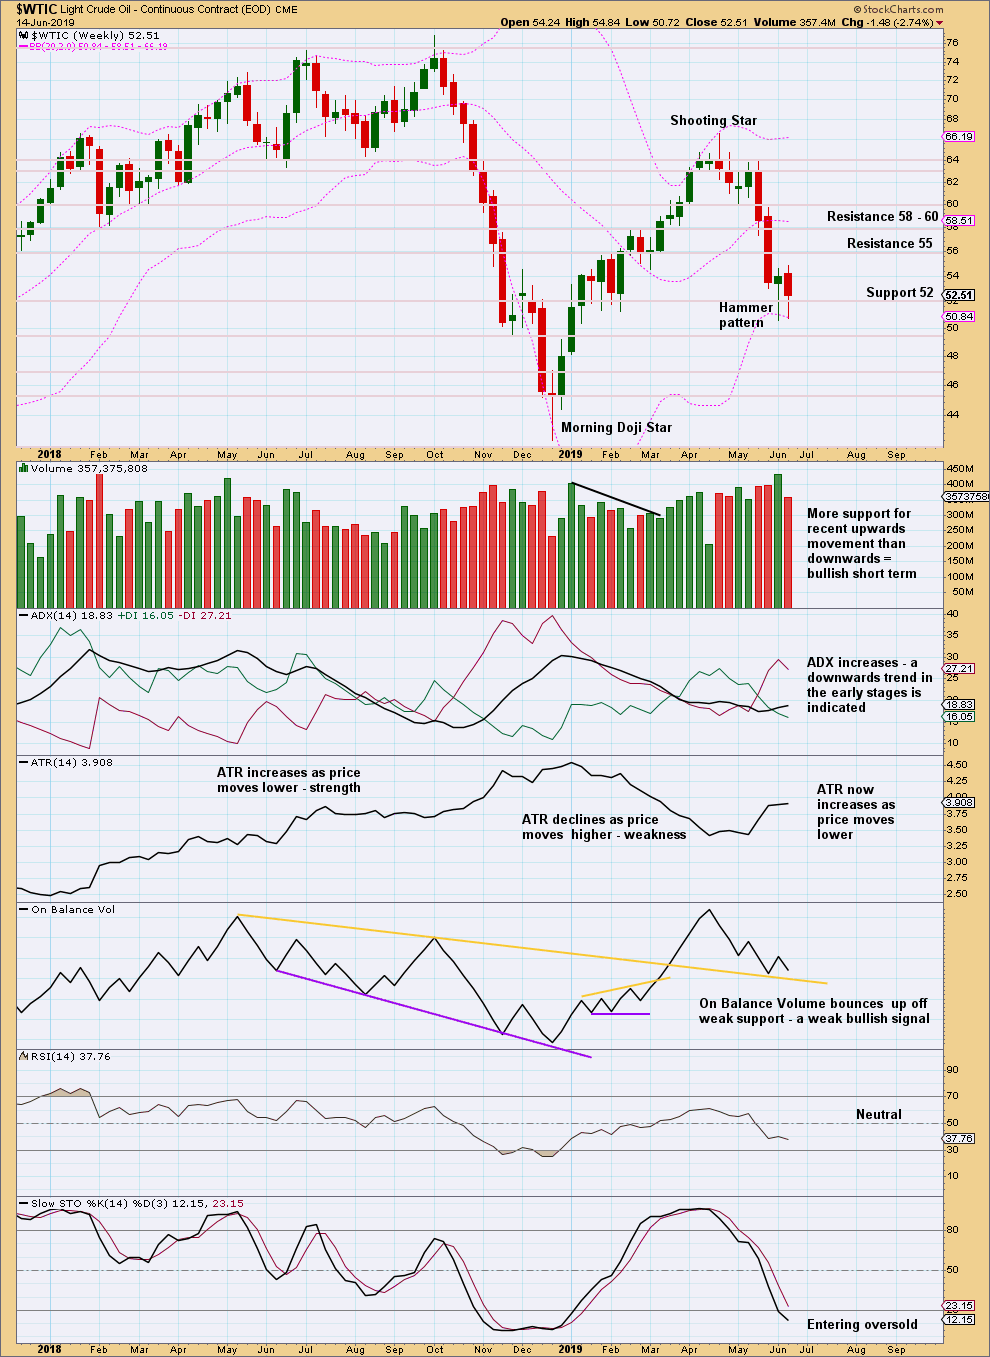
Click chart to enlarge. Chart courtesy of StockCharts.com.
Two weekly candlesticks with long lower wicks looks bullish at least for the short term. The larger trend is down. Bounces and consolidations should be expected to be counter trend movements, until proven otherwise.
DAILY CHART
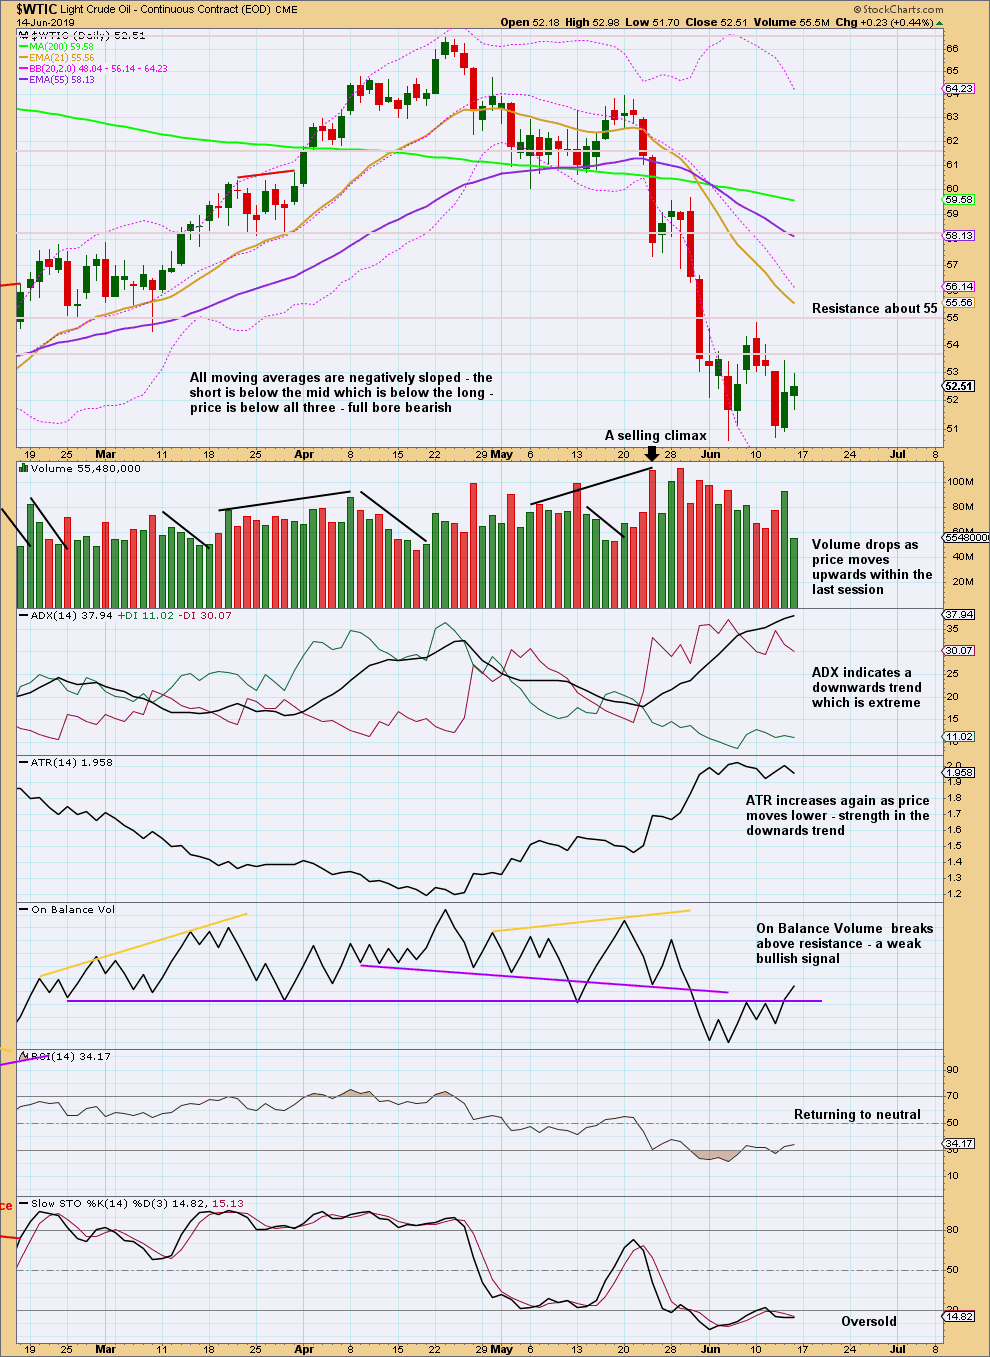
Click chart to enlarge. Chart courtesy of StockCharts.com.
Strong volume for upwards movement on Thursday in conjunction with a bullish signal from On Balance Volume offers support to the main daily Elliott wave count.
—
Always practice good risk management as the most important aspect of trading. Always trade with stops and invest only 1-5% of equity on any one trade. Failure to manage risk is the most common mistake new traders make.
Thank you for all the updates Lara. Your suggestion that 1365ish was the key price point for the bullish scenario saved my butt! Since I trade futures (mostly) I was stopped out before the breakout move. I have started scaling into longs on any price dip with idea that 1375 might get tested. As you know, these price breakouts tend to not offer many entry points! Good luck everyone and I think this could be a quick ride up. Also, full disclosure, I’m more of a believer in the bearish counts overall since I firmly in the camp there are structural debt problems with the miners…however, my willingness to evolve my thinking has served me well over 15 years of futures trading.
That’s excellent Corey, and it brings to attention a key point of my analysis.
When the EW counts have one bull and one bear, there is almost always a clear price point which differentiates the two. When that price point is passed it would be a good idea to switch from bullish to bearish positions or vice versa, and stops may be used to automatically close any losing positions.
I recall back in July 2016 the S&P broke out upwards from a multi month consolidation, the breakout above 2,134 invalidated the bearish wave count and gave confidence in the bullish. At that point most members switched from short to long positions, but I recall one member did not and then wanted help to do so some days later, as his losing position threatened to wipe out his account.
This little story is provided as an illustration of a pitfall to avoid, and how to do avoid it.
The main EW count will not always be the correct one. Sometimes low probability outcomes occur, and when they do so they will never be what was expected as most likely. That is the nature of probability.
The advantage here of EW is it can give specific price points which show where probability shifts from one scenario to another. This helps in setting stops, and may also help in setting orders to open new positions.
Hey Corey,
I am more a believer of the bull case for Gold because of what the Fed has done on Wednesday. Plus when GDX broke down last year, we all thought it would have been a multi-year down draft. It reversed all this resistance and both Gold and GDX are breaking out… This is very impressive.
If Gold goes to 1600 and above, the debt issues will be meaningless.
I currently like KL, AU and GFI.
Cheers,
Mathieu
Yes, agree. The Fed may be bailing out the gold sector!
With the upwards breakout of Gold today I have updated the Gold analysis for Lara’s Weekly members. You can access it here.
Update for US Oil:
Looking at the structure of minute c within minor 4 on lower time frames, I can’t see it yet complete.
The Elliott channel needs to be redrawn. Fourth waves aren’t always contained within a channel drawn using the first technique, so Elliott developed a second technique to redraw the channel when the fourth wave breaches the first. Draw the channel from the ends of the second to fourth waves, then place a parallel copy on the end of the third wave. This channel will be drawn in its final position when we can be confident minor 4 is over.
I’ll expect a little more upwards movement to complete minor 4. The invalidation point remains the same.
Today Gold may be finally breaking out from a multi year consolidation. If this session closes above 1,374.91 (the July 2016 high) on an upwards day which has support from volume, that would be a classic upwards breakout.
Following breakouts, but upwards breakouts in particular, it is typical to see price curve back down to test support at prior resistance. Patience in waiting for that test to find an entry to join a confirmed upwards trend is usually very profitable.
Alternately, if you don’t mind your account being underwater for a few days, joining a trend upon a breakout should have a very high probability of being profitable in the mid to long term.
I am updating Gold right now, the post will be available to Lara’s Weekly members too. To be published in an hour or so.
Well thank you very much. For me, your alternates and no confirmation of a downward breakout, kept me from going short. Now it looks like I will be waiting patiently for the retest to go long. At that point we will be looking at a 3rd of a 3rd of a 3rd. Awesome.
That sounds like a good plan Rodney. I’m glad you were not short!
After an upward breakout it would be very unwise for anyone to still be short.
Lara,
There seems to be a typo in the lowest probability wave count. It says “This wave count sees the three waves back now complete at the last major low for Gold in November 2019.”
Thank you Dave, you’re right. That should read “November 2015”
Will fix in the updated analysis now.
Gold now has only one count left – the low probability count.
I will be buying Gold stocks tomorrow morning.
Wow… Gold is massively breaking out!!!!
Hi Lara,
Any mid-week thoughts on the 4th wave developing in WTIC / USOIL?
Chart above
Thank you, Lara!
Great analysis Lara. It looks like we may soon have another wonderful opportunity to short GDX. I’ve got my eye on it. I sure hope we see oil continue to decline. I need to fill up the 80 gallon gasoline tank on my motorhome!
Wow …. big tank
Thanks Rodney.
Lara, Nice call on oil going higher!
Rodney, Oil breaking February’s lows can’t be good for future economic outlook. I know you need that large gas tank to make it to the next town 🙂 What MPG do you get?
7 MPGs downhill with the wind at my back!
Turns out it wan’t so great after all. But still, I have a bullish count for gold and we have a target to work with.