by Lara | May 8, 2020 | Economic Analysis, Public Analysis
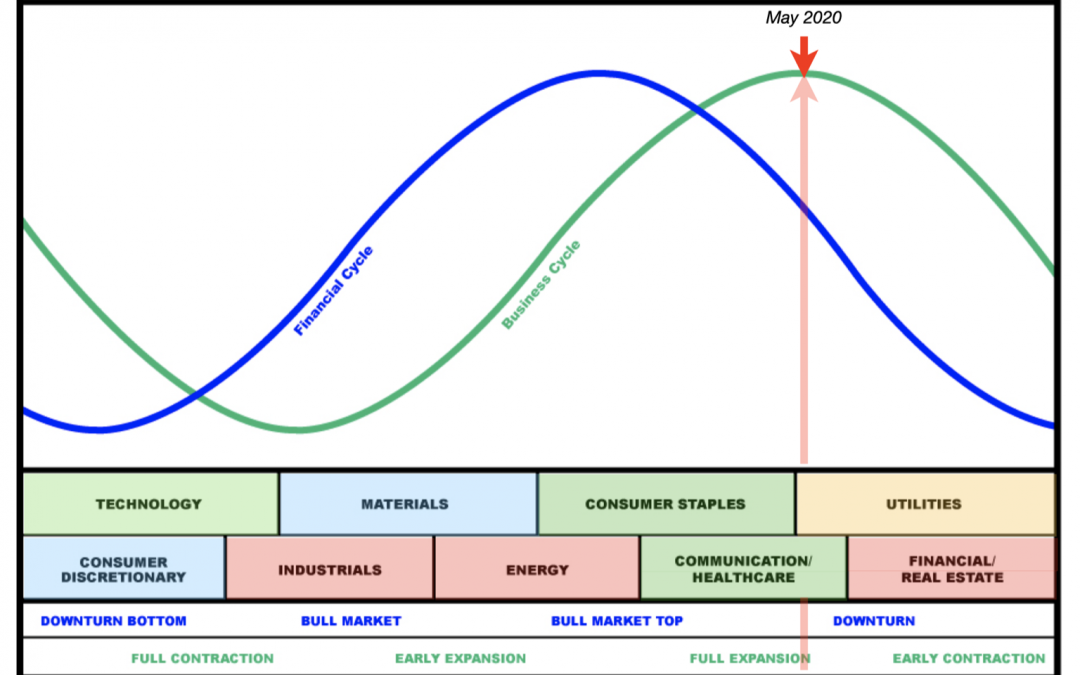
United States: Macro Economic Analysis | Charts – May 8, 2020 Business and Financial Cycle analysis for the USA with data from February 2020. Summary: The business cycle may be on the cusp of full contraction to early contraction. The financial cycle is in a...
by Lara | Nov 5, 2019 | TRENDS Monthly
A new TRENDS Monthly report is now available. The TRENDS Monthly report is available from: Invysis.com. About: In TRENDS Monthly I combine technical analysis with relative rotation graph analysis and macroeconomic analysis to identify stocks within the S&P 500...
by Lara | Sep 12, 2019 | Membership, TRENDS Monthly |
I would like to introduce to Elliott Wave Gold members my new report: TRENDS Monthly. The TRENDS Monthly report will be published on a new website: Invysis.com. In TRENDS Monthly I combine technical analysis with relative rotation graph analysis and macroeconomic...
by Lara | Nov 21, 2017 | AMZN, Education, Public Analysis
Unlike Google, Amazon does not have a neat a trend line. Click chart to enlarge. The solid yellow trend line is Amazon’s equivalent to the Google Forever trend line. The bottom line is that we should assume that Amazon remains in a bull market while price...
by Lara | Oct 31, 2017 | Gold |
Price remains above 1,260.72, so both Elliott wave counts remain valid. Volume and On Balance Volume today are giving signals as to what is most likely to happen next to price. Summary: Upwards movement for a third wave should begin now. The first target is at 1,294...
by Lara | Oct 31, 2017 | Education, GOOG, Public Analysis |
In keeping with the KISS principle, this trend line is very simple. I call it “Google’s Forever Trend Line”. Click chart to enlarge. This trend line has very strong technical significance. It is very long held and has been tested multiple times. It...
by Lara | Aug 2, 2017 | Education, Gold, Public Analysis
Volume analysis is essential to a full technical analysis. One of the simplest techniques is to look at volume during a consolidation and note which days, upwards or downwards, have strongest volume. Click chart to enlarge. Gold has been within a large consolidation...
by Lara | Jul 26, 2017 | Gold, Public Analysis |
US Fed interest rate decision is due out at 2 p.m. EST on 26th of July, and this may move the Gold market strongly two hours before New York closes. Click chart to enlarge. Simple support and resistance may be used to tell in which direction Gold may move and where it...
by Lara | Jul 21, 2017 | Public Analysis, USD Index
The USD index has been trending lower for six months now. A simple wave count at the monthly chart level may indicate what is most likely to happen next. Click chart to enlarge. The Elliott channel (maroon) about cycle wave III is drawn using the first technique: a...
