by Lara | Apr 6, 2021 | Gold, Gold Historical
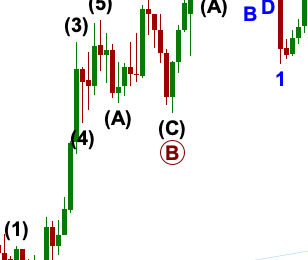
GOLD: Elliott Wave and Technical Analysis | Grand Super Cycle Charts – April 6, 2021 Time to update the Grand Super Cycle analysis and monthly charts. Summary: The Grand Super Cycle analysis expects that it would be most likely that a Grand Super Cycle degree...

by Lara | Nov 23, 2020 | Gold, Gold Historical
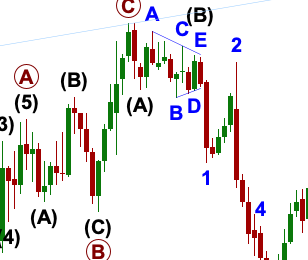
GOLD: Elliott Wave and Technical Analysis | Charts – November 23, 2020 Price has broken below support. For the first Elliott wave count, the main and alternate daily charts are swapped over now that price has indicated which is most likely. Today monthly charts...

by Lara | Jul 31, 2020 | Gold, Gold Historical
GOLD: Elliott Wave and Technical Analysis | Video – July 31,...

by Lara | Jul 31, 2020 | Gold, Gold Historical
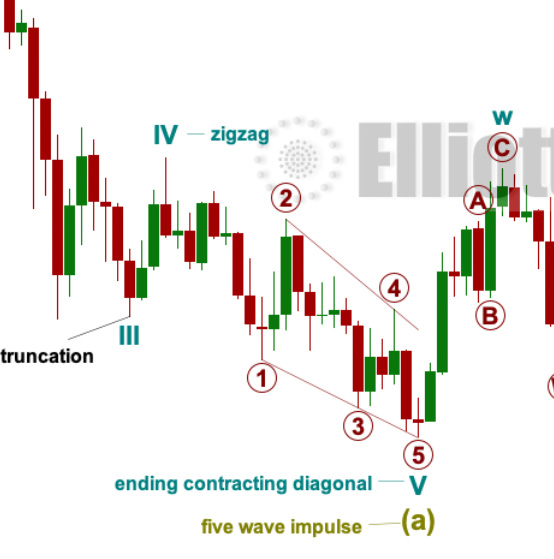
GOLD: Elliott Wave and Technical Analysis | Charts – July 31, 2020 The high remains in place although a short-term price point used for confidence has not been breached. Summary: The target at 1,984 for a third wave to end may not be met. Intermediate wave (3)...

by Lara | May 30, 2020 | Gold, Gold Historical
GOLD: Elliott Wave and Technical Analysis | Monthly Charts – May 29, 2020 Updated Elliott wave and technical analysis monthly charts. Summary: There is an upwards trend and no signals of a trend change. The most likely Elliott wave count expects price to not...

by Lara | Dec 16, 2019 | Gold, Gold Historical |
GOLD: Elliott Wave and Technical Analysis | Charts – December 16, 2019 Price continues sideways. There has as yet been no breakout. Today monthly charts are updated. Summary: The downwards trend may resume to new lows. The Elliott wave target is at 1,348. A...
by Lara | Jul 27, 2019 | Gold, Gold Historical |
At the end of this week, it is time to review monthly charts for Gold. Three Elliott wave counts are published for monthly charts. Summary: There remains an upwards trend in place at the weekly chart level. This week looks like a counter trend movement. However, the...
by Lara | Mar 9, 2019 | Gold, Gold Historical |
Upwards movement on Friday indicates the first wave down is complete. Fibonacci ratios are used to calculate targets. Summary: Three long-term targets are now calculated for cycle wave c to end. Confidence in a new downwards trend may be had with a new low below...
by Lara | Sep 21, 2018 | Gold, Gold Historical |
An update of monthly charts. Summary: The bigger picture sees Gold as most likely still within a B wave, most likely at cycle degree. Each end of week analysis will look at the various remaining viable structures this B wave may be. This analysis also considers the...


