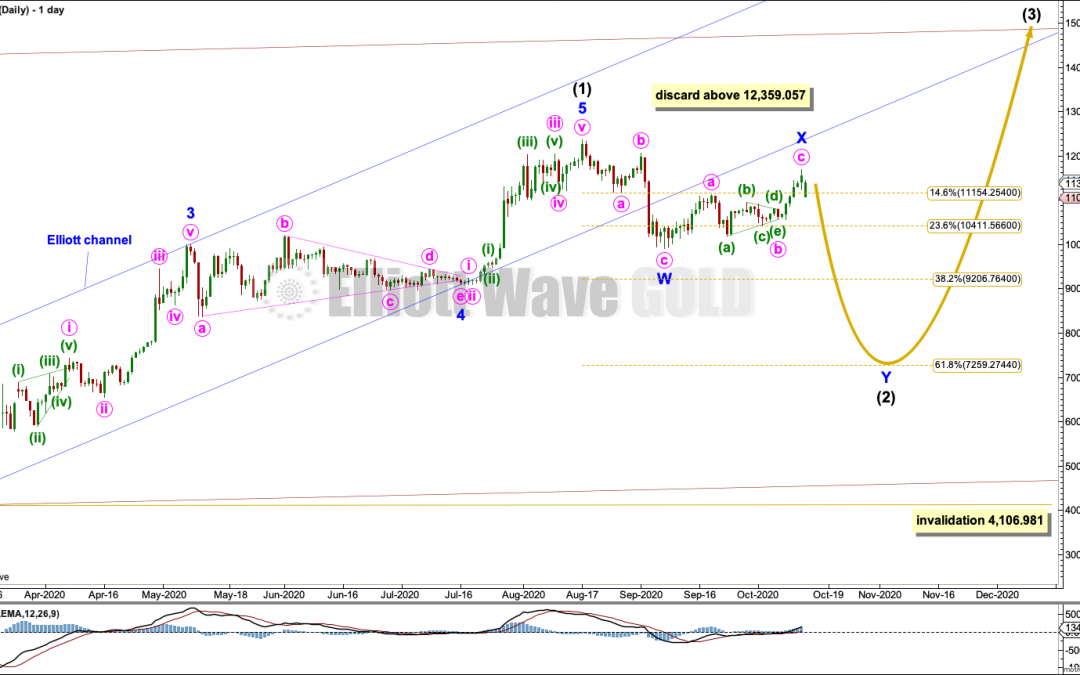
by Lara | Oct 13, 2020 | Bitcoin, Public Analysis
BTCUSD: Elliott Wave and Technical Analysis | Charts – October 13, 2020 Last analysis on September 9th, expected more downwards movement for a multi-week pullback to continue. So far price has moved higher, but has not yet made a new high. Summary: The pullback...
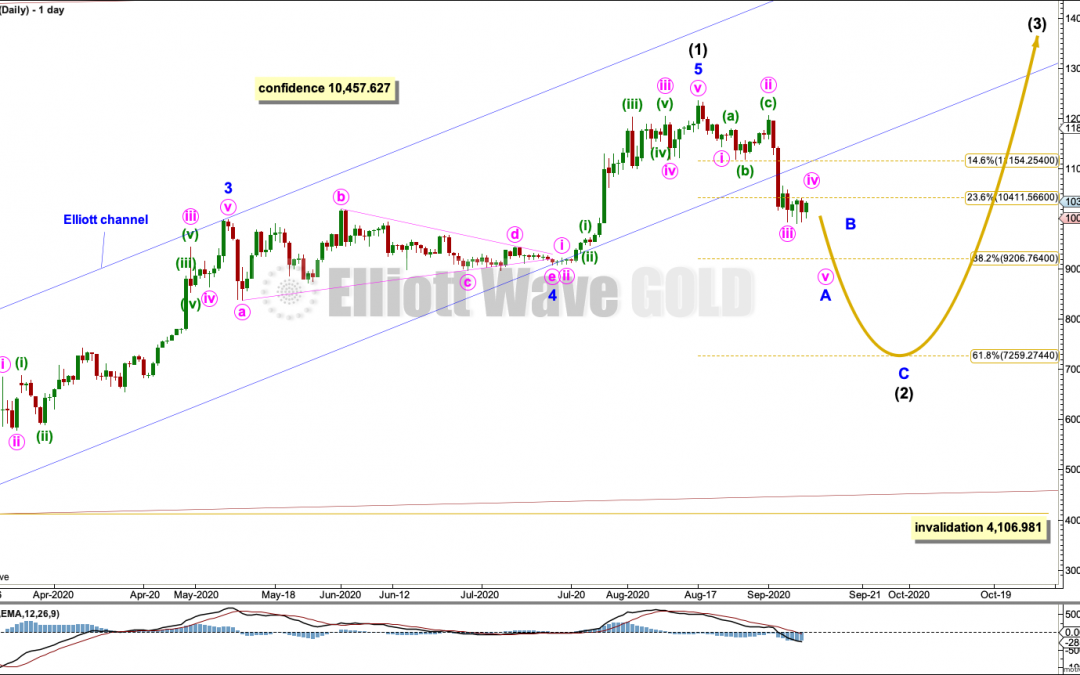
by Lara | Sep 9, 2020 | Bitcoin, Public Analysis
BTCUSD: Elliott Wave and Technical Analysis | Charts – September 9, 2020 Last analysis on August 14, 2020, expected downwards movement for a multi-week pullback. Overall, price has now started to move lower. Summary: This multi-week pullback may remain above...
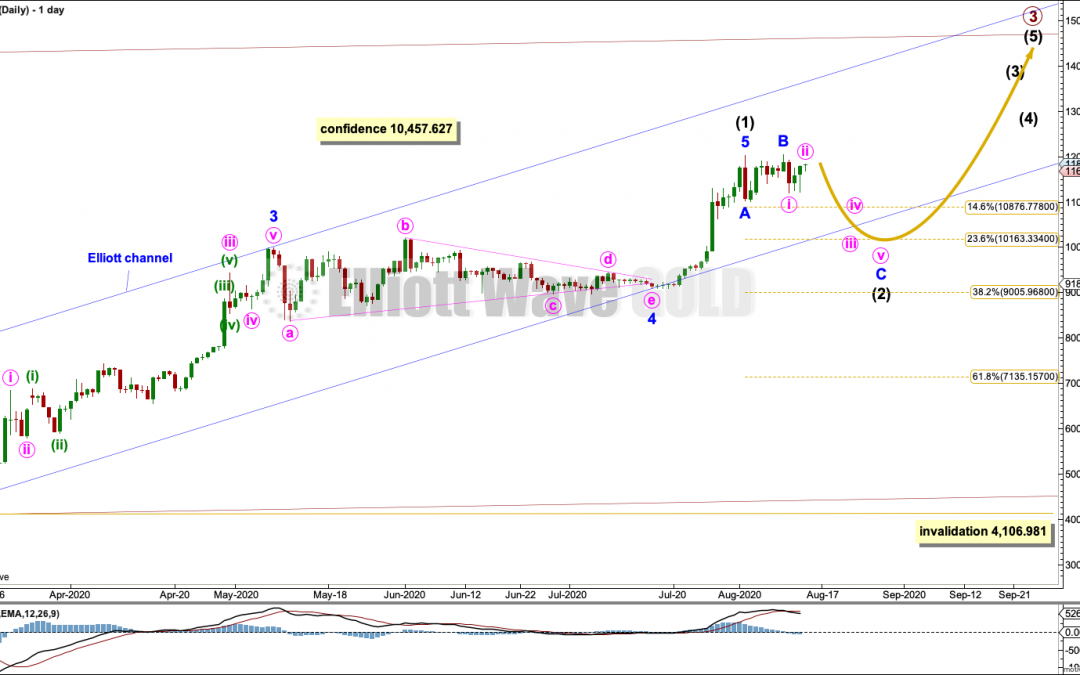
by Lara | Aug 14, 2020 | Bitcoin, Public Analysis
BTCUSD: Elliott Wave and Technical Analysis | Charts – August 14, 2020 Last analysis on May 22, 2020, expected upwards movement. A new high above 10,457.627 has invalidated a bearish alternate Elliott wave count and provided confidence in this bullish Elliott...
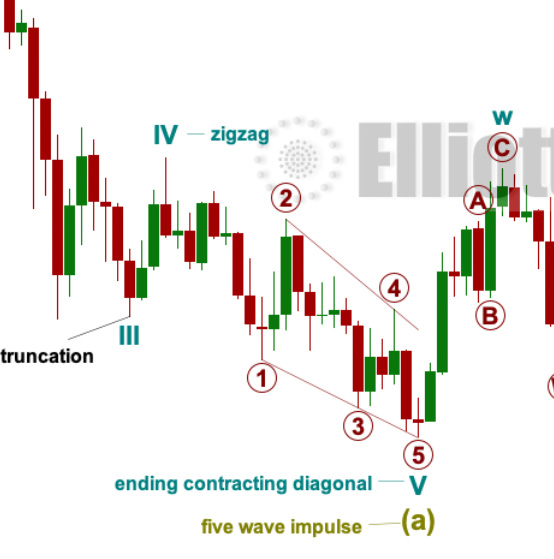
by Lara | Jun 30, 2020 | Education, Public Analysis, Reference
Comprehensive List of Elliott Wave Rules and Guidelines The following is a comprehensive list of all Elliott wave rules and guidelines. Rules are almost the same as Elliott’s original rules as outlined in Frost and Prechter’s Elliott Wave Principle. A few...
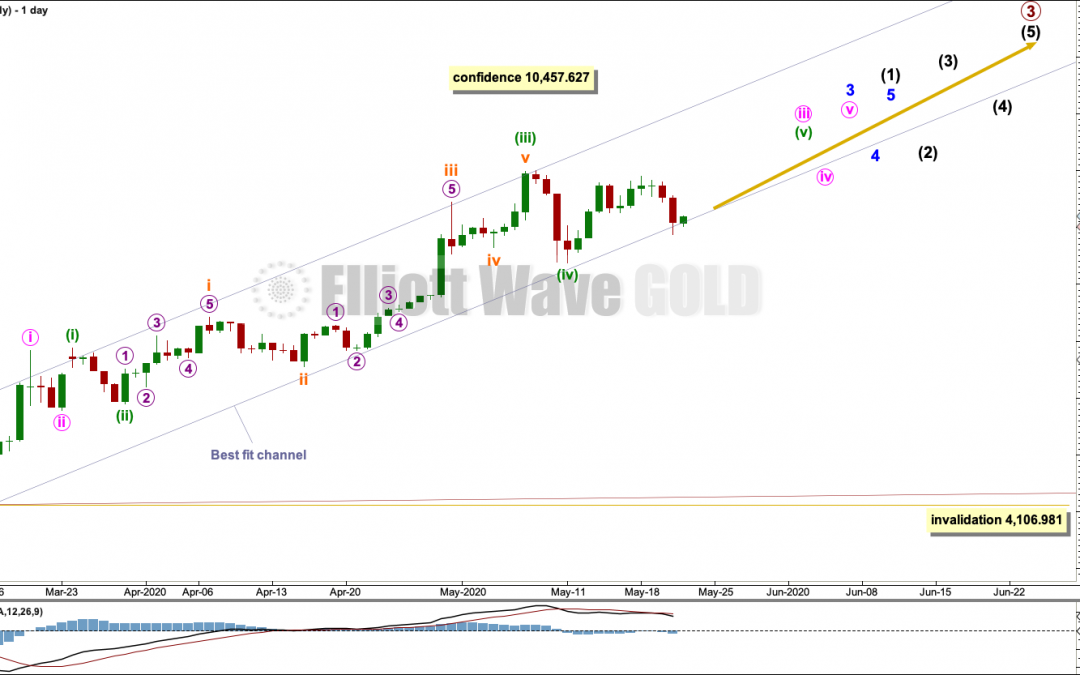
by Lara | May 22, 2020 | Bitcoin, Public Analysis
BTCUSD: Elliott Wave and Technical Analysis | Charts – May 22, 2020 Last analysis on March 25, 2020, expected upwards movement with an invalidation point at 3,191.30. Bitcoin is moving overall higher. The confidence point at 10,457.627 is now close by. Summary:...
by Lara | May 15, 2020 | Public Analysis, USDAUD
USDAUD: Elliott Wave and Technical Analysis | Charts – May 14, 2020 This market does not lend itself very well to Elliott wave analysis. Movement is very choppy and overlapping. Summary: The best Elliott wave count I can find sees the big upwards wave from July...
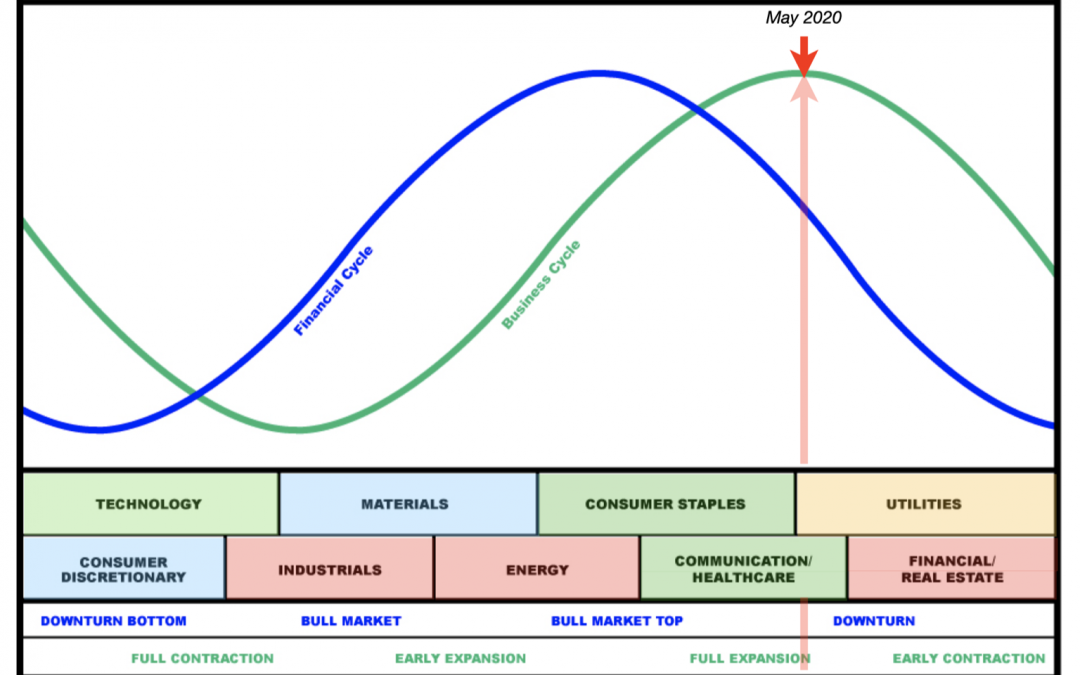
by Lara | May 8, 2020 | Economic Analysis, Public Analysis
United States: Macro Economic Analysis | Charts – May 8, 2020 Business and Financial Cycle analysis for the USA with data from February 2020. Summary: The business cycle may be on the cusp of full contraction to early contraction. The financial cycle is in a...

by Lara | May 1, 2020 | Lara's Weekly, Public Analysis, S&P500
Lara’s Weekly: S&P500 Elliott Wave and Technical Analysis | Charts – March 20, 2020 and March 27, 2020 Example of analysis of the S&P500, included in Lara’s Weekly, for two weeks that cover the important low found on March 23, 2020. 1. Published...
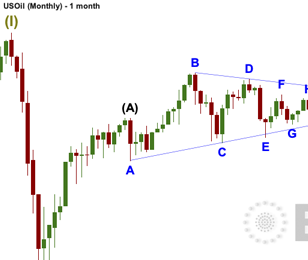
by Lara | May 1, 2020 | Lara's Weekly, Public Analysis, US Oil
Lara’s Weekly: US OIL Elliott Wave and Technical Analysis | Charts – November 20, 2018 and March 13, 2020 Excerpts of two US OIL analyses, in previous Lara’s Weekly reports, from two key dates in US Oil price history: November 20, 2018 and March 13, 2020....
